Figures & data
Figure 2. The effect of sanazole, HT and the combination of sanazole and HT on DNA fragmentation in U937 cells. The cells were treated first with 10 mM sanazole for 40 min, exposed to HT at 44°C for 20 min and the cells were further treated with the drug at 37°C for 6 h. DNA fragmentation assay was carried out. The results are presented as the means ± SD (n = 3). *p < 0.05.
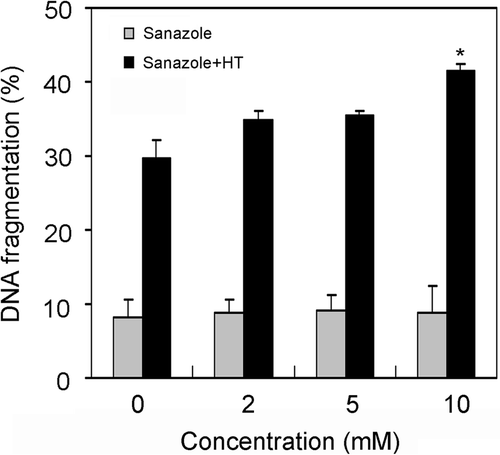
Figure 3. Assessment of apoptosis induced by sanazole, HT and the combination of sanazole and HT. The cells were treated first with 10 mM sanazole for 40 min, exposed to HT at 44°C for 20 min and the cells were further treated with the drug at 37°C for 6 h. (a) Apoptotic features in response to the combination with HT and sanazole in U937 cells. Signs of apoptosis were detected by Giemsa staining and then examined under a microscope at a magnification of ×400. The results are presented as the means ± SD (n = 3). (b) Cells were collected and stained with Annexin V-FITC and PI for flow cytometry. The results are presented as the means ± SD (n = 3). *p < 0.05.
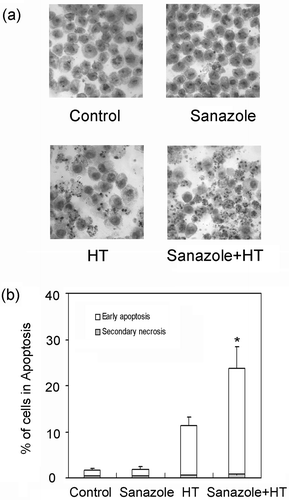
Figure 4. Generation of superoxide induced by sanazole, HT and the combination of sanazole and HT. (a) Dose-dependent changes in intracellular superoxide 6h after sanazole alone (2, 5 and 10 mM). (b) Time-dependent changes in intracellular superoxide (0, 1, 2, 3 and 6 h) after the treatment of 10 mM sanazole. (c) Induction of superoxide by sanazole and HT in U937 cells. The cells were treated first with 10 mM sanazole for 40 min, exposed to HT at 44°C for 20 min and the cells were further treated with the drug at 37°C for 1 h. The results are presented as the means ± SD (n = 3). *p < 0.05.
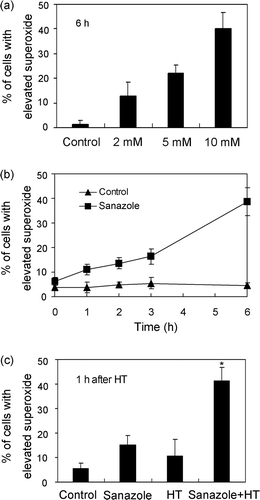
Figure 5. Effect of sanazole, HT and the combination of sanazole and HT on the generation of intracellular H2O2 in U937 cells. (a) Time-dependent changes in intracellular H2O2 induced by sanazole in U937 cells. (b) Induction of intracellular H2O2 by sanazole, HT and the combination of sanazole and HT. The cells were treated first with 10 mM sanazole for 40 min, exposed to HT at 44°C for 20 min and the cells were further treated with the drug at 37°C for 1 h. (c) Effects of NAC (5 mM) on DNA fragmentation induced by sanazole (10 mM), HT (44°C, 20 min) and the combination of sanazole and HT. The results are presented as the means ± SD (n = 3). *p < 0.05.
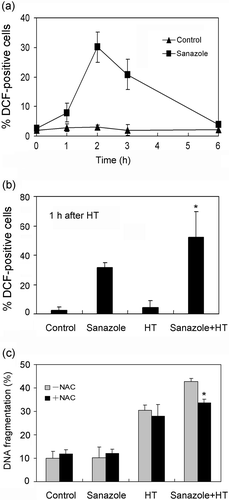
Figure 6. Loss of MMP and activation of caspase-8 and -3 induced by sanazole, HT and the combination of sanazole and HT. The cells were treated first with 10 mM sanazole for 40 min, exposed to HT at 44°C for 20 min and the cells were further treated with the drug at 37°C for 6 h. (a) Loss of MMP was noted in the cells with HT treatment with or without sanazole as measured by flow cytometry using TMRM staining. (b) Activation of caspase-8 was measured by FLICE/Caspase-8 colorimetric protease assay kit. (c) Activation of caspase-3 was measured by flow cytometry using FITC-DEVD-FMK staining. The results are presented as the means ± SD (n = 3). *p < 0.05.
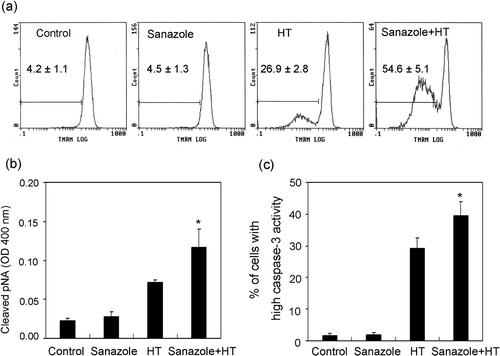
Figure 7. Changes in the expression of apoptosis-related proteins induced by sanazole, HT and the combination of sanazole and HT. The cells were treated first with 10 mM sanazole for 40 min, exposed to HT at 44°C for 20 min and the cells were further treated with the drug at 37°C for 6 h. (a) The changes of Bcl-2 family proteins. (b) Expression of cytochrome c in cytosolic fraction.
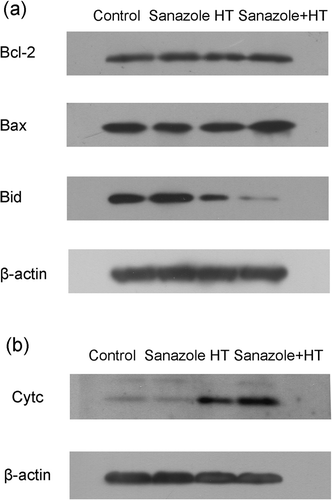
Figure 8. Effects of sanazole, HT and the combination of sanazole and HT on expression of Hsp70 and externalization of Fas. The cells were treated first with 10 mM sanazole for 40 min, exposed to HT at 44°C for 20 min and the cells were further treated with the drug at 37°C for 6 h. (a) The expression of Hsp70 is measured by Western blot. (b) The externalization of Fas was measured by flow cytometry using anti-Fas FITC-conjugated antibody. The results are presented as the means ± SD (n = 3). *p < 0.05.
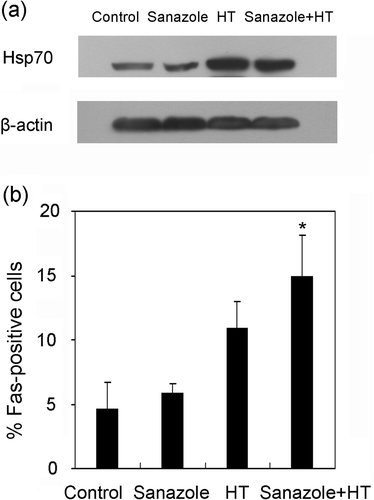
Figure 9. Effects of sanazole, HT and the combination of sanazole and HT on [Ca2+]i. U937 cells were stained with Fura-2/AM as described in Materials and methods immediately after treatment with HT in the presence or absence of sanazole, and [Ca2+]i was then measured. (a–d) Digital images of Fura-2 fluorescence. (e–f) The histograms of [Ca2+]i. (a, e) Control; (b, f) 10 mM of sanazole alone; (c, g) HT alone; (d, h) Combination of HT and sanazole.
![Figure 9. Effects of sanazole, HT and the combination of sanazole and HT on [Ca2+]i. U937 cells were stained with Fura-2/AM as described in Materials and methods immediately after treatment with HT in the presence or absence of sanazole, and [Ca2+]i was then measured. (a–d) Digital images of Fura-2 fluorescence. (e–f) The histograms of [Ca2+]i. (a, e) Control; (b, f) 10 mM of sanazole alone; (c, g) HT alone; (d, h) Combination of HT and sanazole.](/cms/asset/2e159192-3e31-4711-9302-3cc9d7a4ca94/ihyt_a_396913_f0009_b.gif)
