Figures & data
Table 1. The parameters used in the modelling, as well as for the cellular experiments.
Figure 1. Simulated temperature distribution radially along the x-axis at steady-state at the cellular level. The peak temperature was 67 °C, and dropped to just below 47 °C 200 μm from the centre. Laser power: 250 mW, start temperature: 37 °C, distance glass surface to fiber tip: 200 μm.
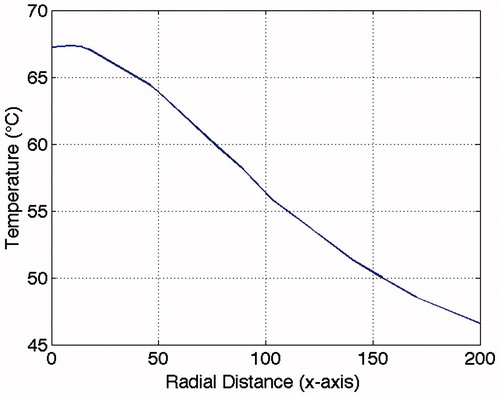
Figure 2. Light microscopy and fluorescence microscopy image of the marks of four pulse lengths (as indicated in the images). (A) The marks are barely visible in the light microscopy image, but clearly visible in the fluorescence image; (B) the white lines in the 10-s mark indicate how the diameter measurements were performed (scale:μm). Scale bar: 200 μm.
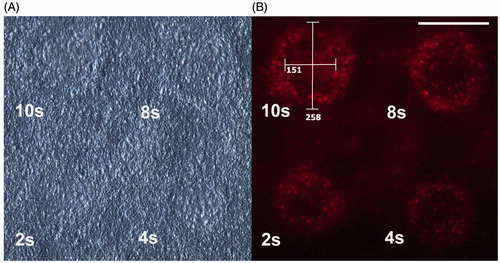
Table 2. The average outer radial distances calculated from the diameters measured 2 h following laser exposure, the corresponding extracted temperatures, and the number of measurements (n).
Table 3. The average inner radial distances calculated from the diameters measured 2 h following laser exposure, the corresponding extracted temperatures, and the number of measurements (n).
Figure 3. The temperature (K) at the perimeter of the damage plotted versus laser pulse durations (s), and the resulting curve fit (solid line) using the Arrhenius model, T = Ea/(R·ln(t·Am)). The fit gave the activation energy Ea of 333.6 kJ mol−1 and the combined frequency factor Am, of 1.50 × 1050 s−1 (See for data). The goodness of the fit (R2) is 0.988, which indicates a good fit.
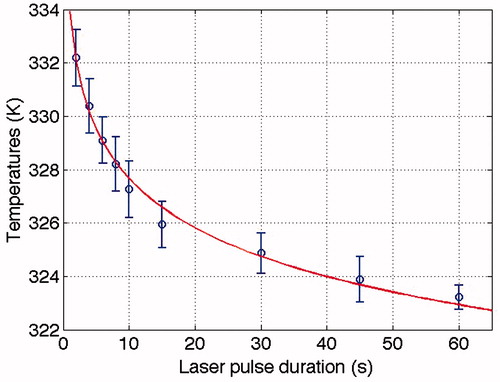
Figure 4. Comparison of the extracted temperatures (K) from the previous astrocyte study [Citation24] (stars and blue dashed line) and the present cortical cell study (circles and red solid line). The comparison show that the results match, and that both curves are plotted within the standard deviations.
![Figure 4. Comparison of the extracted temperatures (K) from the previous astrocyte study [Citation24] (stars and blue dashed line) and the present cortical cell study (circles and red solid line). The comparison show that the results match, and that both curves are plotted within the standard deviations.](/cms/asset/12af05d8-d195-4d48-9d76-f04c43c70ce1/ihyt_a_1181275_f0004_c.jpg)
Figure 5. Fluorescence microscopy (top) and corresponding light microscopy (bottom) images of four positions exposed to sub-second pulses. Total stimulation time was 30 s, with a pulse frequency of 10 Hz (i.e. 300 pulses). The 20-ms pulses gave no visible mark, whereas the other three did so. The size of the marks increased with increased pulse length. Scale bar: 200 μm.
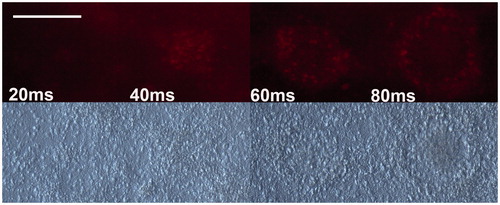
Table 4. The average radial distances calculated from the diameters measured 2 h following laser exposure, the corresponding extracted peak temperatures and the number of measurements (n) for the four sub-second pulse lengths. Note that values for the 30-s pulse have been added for comparison.
Figure 6. Lowering of spontaneous action potential activity on one electrode during application of sub-second laser pulses, positioned about 500 μm away from the centre of the laser. Top trace is the laser trigger output.
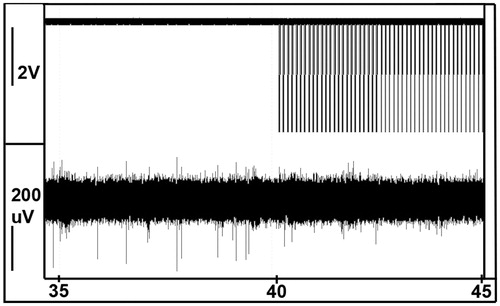
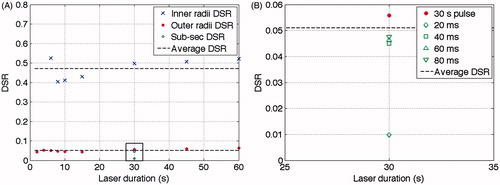
Figure 7. The calculated damage signal ratios, DSR, for all pulse lengths. (A) Blue crosses: DSR for the inner radii. Red dots: DSR for the outer radii. Green circles: DSR for the sub-second radii. Black dashed lines: the average DSR for outer radii (0.051) and inner radii (0.47) respectively. (B) Enlargement of the box in the lower part of A, showing the DSR for the 30-s pulse as well as the sub-second pulses. The DSRs for the sub-second pulses were positioned at 30 s, which is the total length of all pulsed stimulations. Note that the 20 ms pulses did not give any observable effect on the cells but was the calculated maximum value of the DSR at the center on the beam.