Figures & data
Figure 1. (A) Schematic of facet joint FUS ablation, showing the FUS beam (blue) aimed at the surface of the facet joint, and the far field of the beam aimed away from the spinal cord. (B) Schematic of the proposed FUS ablation approach with direct targeting of the medial branch (MB) nerve and far field area and spinal canal (black line) partially overlapping.
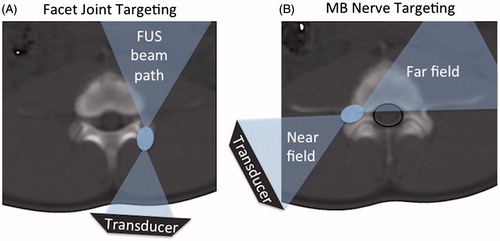
Figure 2. (A) Schematic of a FUS treatment set-up showing the axial MR image of the set-up with a swine positioned on top of the gel pad and the FUS beam focus (green rectangle) placed between the articular and transverse processes (labelled as ap and tp). The FUS beam is aimed directly at the MB nerve. (B) Example of region-of-treatment contour (solid magenta contour) drawn by the operator during the planning phase. Dashed green rectangles represent the focal regions of the individual sonications automatically prescribed by the planning software. (C) Example of planning where no region of treatment was prescribed and instead each sonication’s focal region (dashed green rectangle) was individually placed by the operator.
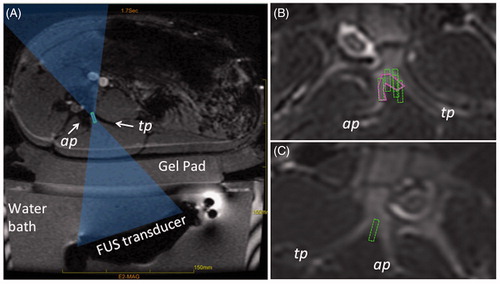
Table 1. Summary of the in vivo acute and subacute experiments.
Figure 3. MB nerve in Yorkshire swine was found to pass adjacent to the bone at the junction of the transverse and articular processes (labelled tp and ap). On histology (A), the nerve is seen surrounded by a layer adipose tissue (arrow). Scale bar is 1 cm. On MRI (B), a small hyper-intense region surrounded by a hypo-intense rim (arrow) corresponds to the position of the nerve determined from histology. Location of spinal cord is labelled as sc.
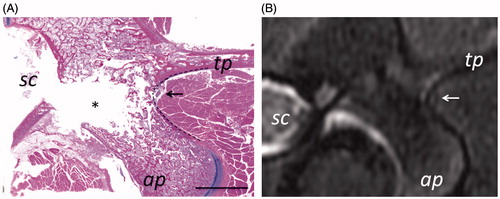
Figure 4. Follow-up contrast-enhanced cropped MR and CT images from subacute experiment 1, showing the changes in contrast uptake from ablation of the vertebral level target at L4 using nine sonications. Location of the axial slice (A) is shown with a white dashed line on the oblique coronal image (C), and the axial slice shown in (B) is positioned adjacent and caudal to the slice in A. Thermal lesions appear as non-enhancing areas (white arrows) due to the lack of perfusion resulting from thermal damage. The dashed double-sided arrow in D shows the measurement of the extent of the lesion along the hypotenuse between the transverse and articular processes as reported in . The solid double-sided arrow shows the measurement of the thickness of the pedicle bone. Scale bar is 2 cm.
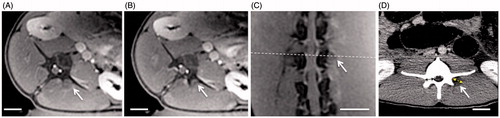
Figure 5. (A–C) Example of heating of transverse process in acute experiment 2. (A) Cropped magnitude image of the MR thermometry sequence with an overlay of the focal spot and the beam path, as displayed by the planning software. (B) Peak temperature that resulted from a sonication planned in A with acoustic energy 646 J (acoustic power of 32 W and sonication duration of 20 s). Highest temperature was 63 °C. (C) Contrast-enhanced MR image showing a hypo-intense region at the edge of the transverse process (arrowhead) corresponding to the location of heating in B. (D) Follow-up contrast-enhanced MR image from acute experiment 3, showing the lesion, a non-enhancing region labelled with an arrowhead, which shifted away from the medial branch nerve due to the shift of the animal’s position.
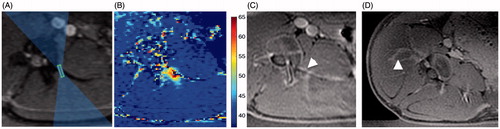
Figure 6. Examples of gross pathology from the acute experiment 2 and subacute experiment 1. Ablation in muscle tissue (black arrow) appears as a paler area in the acute case (A, B) and the area surrounded by the brown rim in the subacute case (C, D). The brown rim of haemorrhage is apparent in the superficial region of the bone (asterisk) in the subacute case (C). The nerve roots, superior to the ablations, appear normal on gross pathology (B, D). The dashed box shows the region selected for histological analysis. The subacute gross pathology image corresponds to the follow-up images in Figure 4.
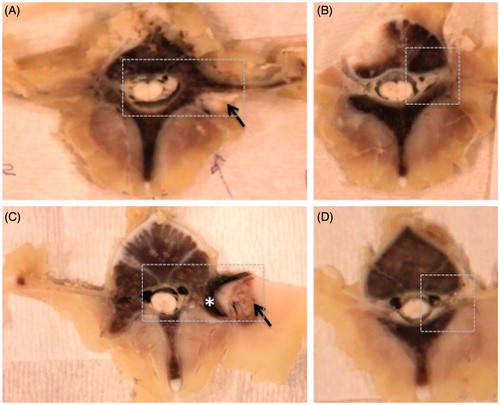
Figure 7. Low magnification images of haematoxylin and eosin histology from the acute (A) and subacute (B) studies. The dark red rim of haemorrhage (short arrows) visible at the surface of the bone between the articular process (ap) and transverse process (tp) made thermal lesions readily visible in subacute cases, compared to the acute cases. Changes in bone do not reach the spinal canal (sc). The nerve is shown with a long arrow. The dashed line delineates the interface between the bone and muscle. 1 mm scale bar.
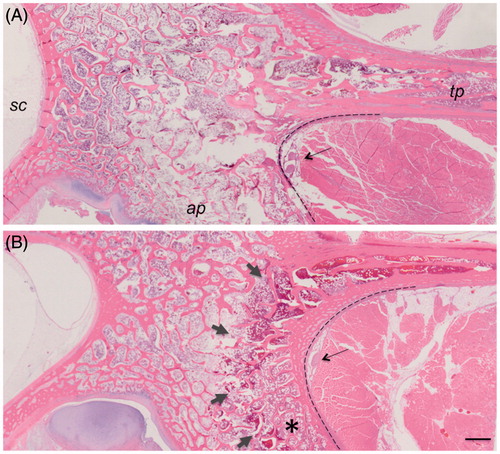
Figure 8. Haematoxylin and eosin histology of the targeted nerve and adjacent muscle. Compared to normal muscle (A), ablated muscle showed swelling of muscle fibres, sarcoplasmic hypereosinophilia and fragmentation, and nuclear shrinkage (B) with macrophages present at the boundary of the lesion in subacute cases (arrow, C). 50 μm scale bar. Compared to the control nerve (D), the ablated nerve exhibited at least one, and often a combination, of the following changes: hyalinisation of epineurial collagen (asterisk E), nuclear shrinkage (arrow E, F), hyperaemia of endoneurial vessels (long arrow, F), and loss of axons associated with dilation of the myelin sheath (arrowhead F). 20 μm scale bar.
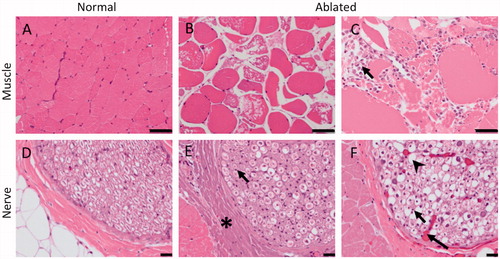
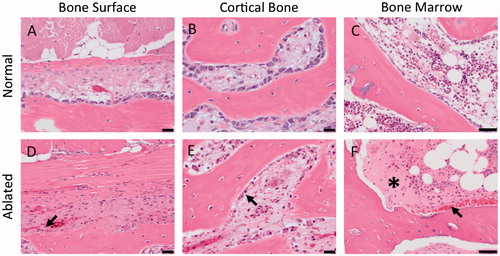
Figure 9. Haematoxylin and eosin histology showing the cellular changes in the bone adjacent to the ablated MB nerve. Compared to control tissue, ablated bone had the following changes: shrinkage of osteoblasts (arrow D, E) and increased eosinophilia of the extracellular spaces (asterisk) and haemorrhage (arrow) in bone marrow (F). 50 μm scale bar.