
Figures & data
Figure 1. Set-up for experimental measurement of SAR. (a) Tissue sample is heated with MW antenna and temperature is recorded with infrared (IR) camera data and thermocouples. (b) Transient temperature data is analysed for each pixel and (c) SAR is calculated. Thermocouples are used to calibrate IR camera data temperature.
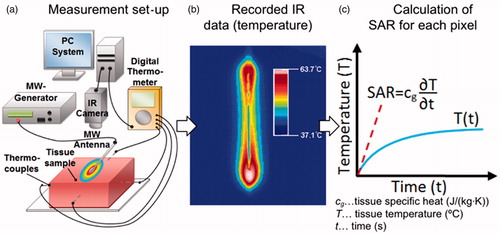
Figure 2. Example temperature change at a specific location during an ablation experiment in which the power was intermittently turned off to correct for thermal conduction.
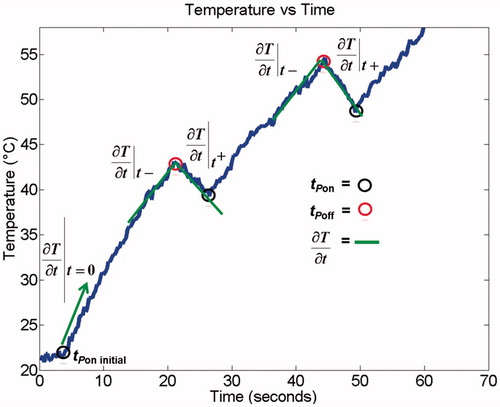
Figure 3. Simulation geometry of the MWA antenna at an air–liver boundary that was compared to the experimental temperature and SAR data. Note that the ablation zone is on the surface of the liver (not in air), and the distance from the ablation zone to the simulation boundary (edge of liver) is approximately 6–8 cm.
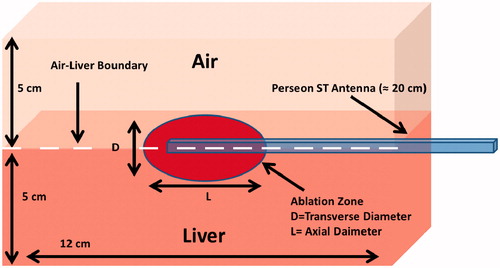
Table 1. Temperature-dependent liver dielectric and thermal property parameterisation used in the models.
Figure 4. (a) Experimental (top) and simulated (bottom) temperature profiles during the course of an ablation experiment using the short-tip applicator. (b) Experimental (top) and simulated (bottom) SAR spatial profiles during the course of an ablation experiment using the short-tip applicator. Black lines indicate antenna position. White dotted lines in (a) at t = 360 s mark the position where the temperature profile is plotted in .
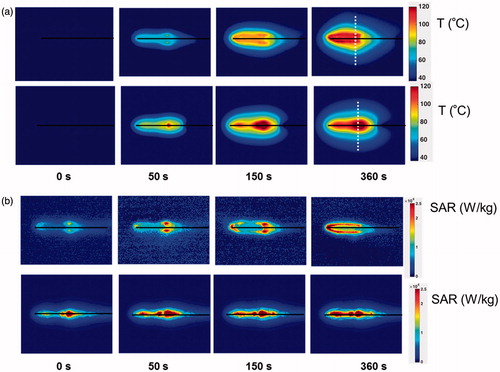
Figure 5. (a) Experimental (top) and simulated (bottom) temperature profiles during the course of an ablation experiment using the long-tip applicator. (b) Experimental (top) and simulated (bottom) SAR spatial profiles during the course of an ablation experiment using the long-tip applicator. Black lines indicate antenna position. White dotted lines in (a) at t = 360 s mark the position where the temperature profile is plotted in .
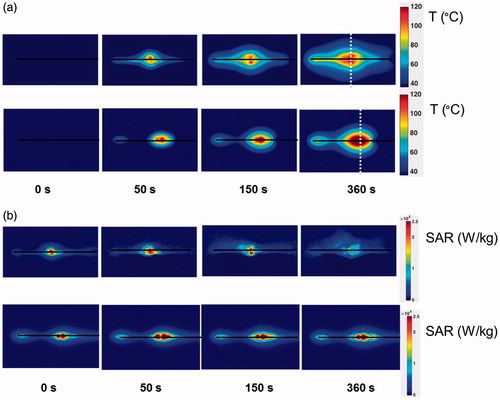
Figure 6. Axial view of a 15-W, 6-min ablation on an ex vivo liver sample using the short-tip applicator (left) and long-tip applicator (right).
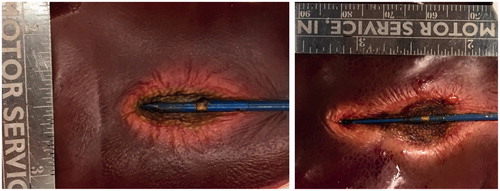
Figure 7. Radial temperature profile along dotted line in Figures 4 and 5, compared between simulation and experiment using (a) the short-tip (ST) and (b) the long-tip (LT) applicators. Temperature is shown after 6 min of ablation. Average difference between experiments and simulation was 5.6 °C (ST applicator) and 6.2 °C (LT applicator).
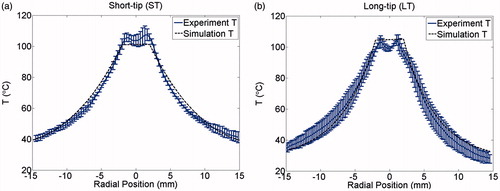
Figure 8. Comparison of simulation and experiment using the short-tip (ST) applicator. The solid black line is the simulation and each individual shade of grey line corresponds to a different actual experiment. The 60 °C isothermal contour was used to compare the extent of the ablation zone of simulation versus experiment (n = 3) at 1 min (DSC agreement =0.79 ± 0.07)), 3 min (DSC agreement =0.83 ± 0.03) and 6 min (DSC agreement =0.85 ± 0.03). Temperature maps are shown from the simulation.
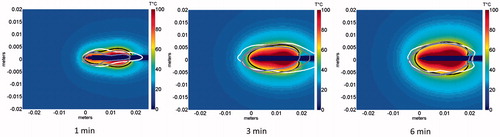
Figure 9. Comparison of simulated transient SAR profile with the experimentally measured SAR profile during ablation for the short-tip antenna. Note that only the simulated SAR profile captures the antenna outline (see arrow), which contributes to the discrepancy in Dice coefficients between the model and the experiment.
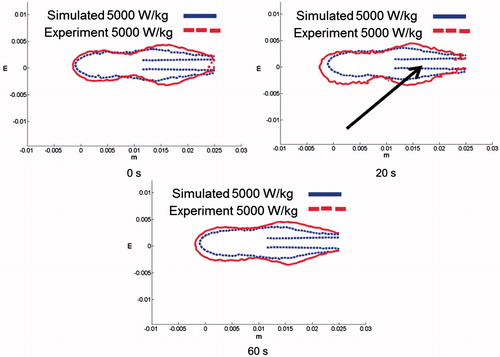
Table 2. Dice coefficient (DSC) comparison of the SAR profiles between ex vivo experiments and simulation at various time points, for both short-tip and long-tip applicators.