Figures & data
Figure 1. Temperature distribution for a typical thermal ablation therapy.
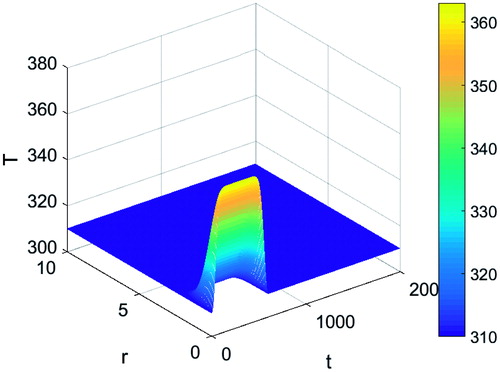
Table 1. List of the tissue thermomechanical parameters and applicator temperature.
Table 2. List of simulation parameters.
Figure 2. Tissue displacement during a typical thermal ablation temperature distribution ignoring protein denaturation effects.
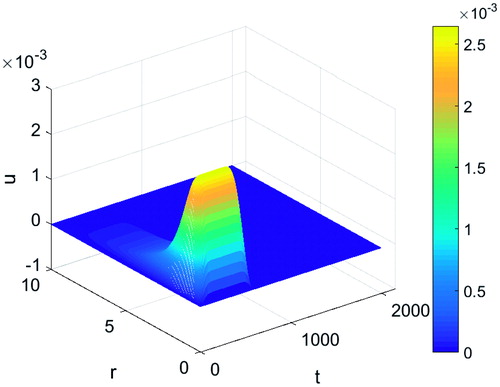
Figure 3. Plot of protein proportion in its (A) native and (B) unfolded state during a typical thermal ablation temperature distribution.
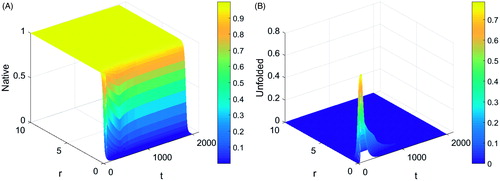
Figure 4. Tissue displacement during a typical thermal ablation temperature distribution.
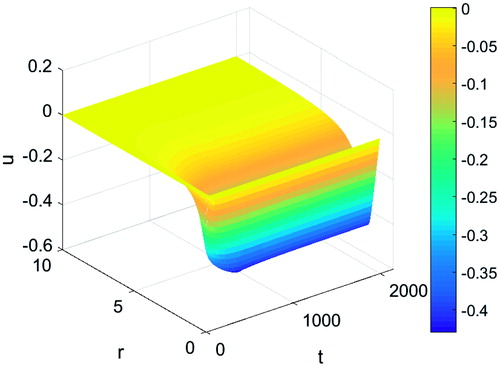
Figure 5. Tissue displacement at various time points during a typical thermal ablation temperature distribution.
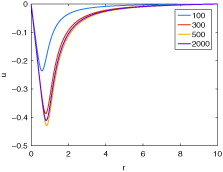
Figure 6. Tissue displacement during a typical thermal ablation temperature distribution with a Poisson's ratio of (A) 0.35 and (B) 0.25.
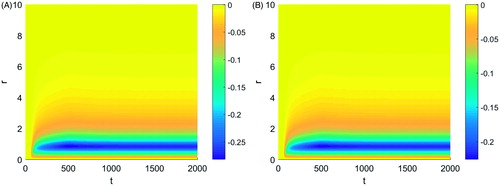
Figure 7. Tissue displacement during a typical thermal ablation temperature distribution with an applicator temperatures of (A) 80 °C and (B) 70 °C.
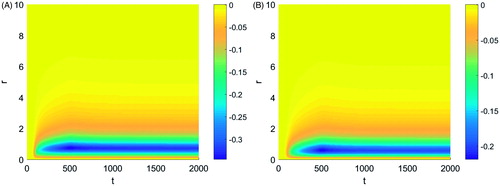
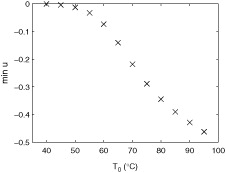
Figure 8. Maximum tissue contraction for varying applicator temperature during a typical thermal ablation temperature distribution.