Figures & data
Figure 1. Schematic cross-section of a wIRA radiator (type hydrosun® 750, Hydrosun, Müllheim/Baden, Germany). The filament of the halogen lamp is placed in the focal point of a spherical, concave mirror with a radius of 40 mm in order to ideally parallelize the radiation. In practice, radiation leaving the radiator shows a central, homogeneous zone (orange) and a divergent fringe (dark orange) serving as ‘penumbra’ when two radiators are combined.
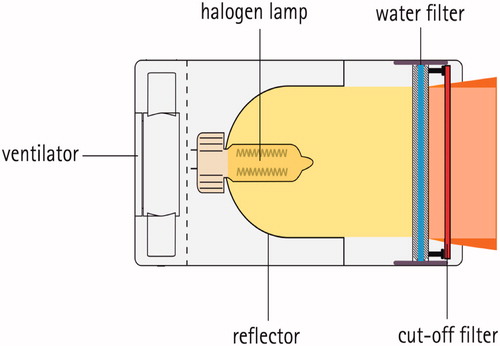
Figure 2. Currently used wIRA-hyperthermia system with two radiators (type hydrosun®-TWH1500) to treat large-size (broad, superficial) breast cancer recurrences. Both radiators are steered independently by two thermographic cameras and safety pyrometers.
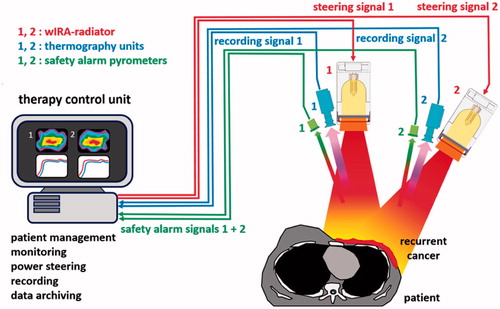
Figure 3. Spectral irradiance of the wIRA irradiator as shown in Figure 1 (type hydrosun® 750) as a function of wavelength. Curve 1: With inserted water filter (thickness of the water layer =7 mm) and a cut-off filter of type BTE 595 (BTE Elsoff, Germany). The spectral output is limited to wavelengths between 590 nm and 1400 nm. Curve 2: Unfiltered halogen radiation (uHR) at about 2900 K CCT. CCT: correlated color temperature.
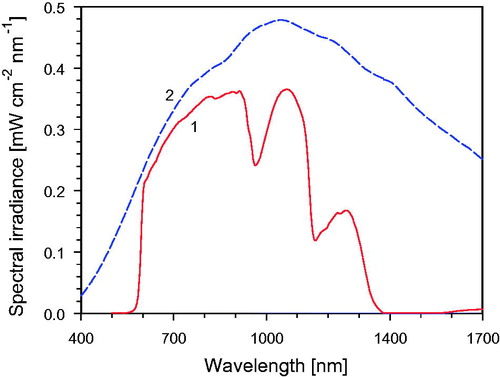
Figure 4. Total irradiance of the wIRA radiator as shown in Figure 1 (type hydrosun®750) equipped with a cut-off filter (type BTE 595; BTE, Elsoff, Germany) as a function of the distance between the radiation exit window and the treatment field. The dotted vertical line indicates the standard distance of 33 cm, the horizontal line the corresponding irradiance of 200 mW cm−2.
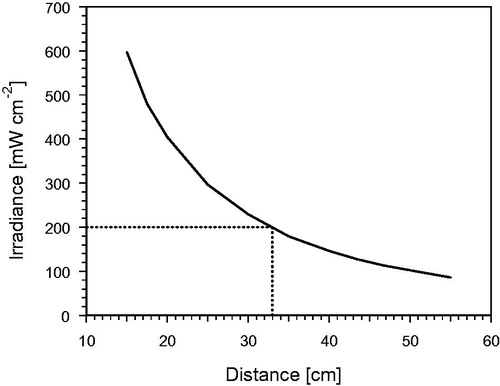
Figure 5. (A) Horizontal distribution of relative irradiance at different (frontal) distances from the radiation exit window, measured for a single radiator (type hydrosun®750). Horizontal distances were referred perpendicular to the optical axis. The distance of 33 cm is recommended for standard applications. (B) Superposition of the radiations of two wIRA-radiators in dependence of their horizontal distance. The optimal distance between the two axes is 23.5 cm. The advantage of the penumbra is allowing such configuration without hot spot.
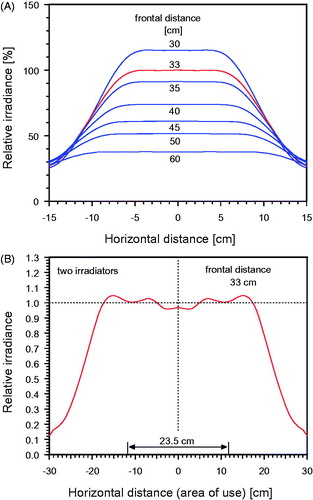
Figure 6. Thermographic control at the onset and during wIRA-hyperthermia. A pigmented senile wart (arrow) was detected early after starting the therapy because of its relatively high absorbance due to chromophores resulting in rapid temperature elevation. In order to avoid its influence on the power steering, the wart was protected with tape, so that heating of the region of interest was no more disturbed. Treated region with field marks is indicated by the solid line; broken rectangle depicts the area protected with tape.
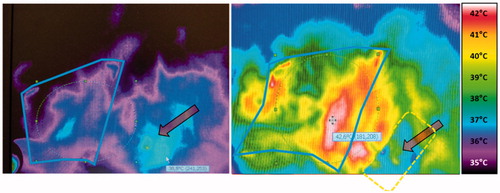
Figure 7. Relative spectral absorbance of radiation (visible light + wIRA) as a function of wavelength measured in vivo in human soft tissue (ear lobe) at a depth of 2.4 mm (fair skin). Data calculated from direct measurements of spectral remittance and transmittance [Citation38].
![Figure 7. Relative spectral absorbance of radiation (visible light + wIRA) as a function of wavelength measured in vivo in human soft tissue (ear lobe) at a depth of 2.4 mm (fair skin). Data calculated from direct measurements of spectral remittance and transmittance [Citation38].](/cms/asset/01fce305-c61e-46ee-a42a-4e56a4f3e683/ihyt_a_1469169_f0007_c.jpg)
Figure 8. Optical characteristics of wIRA compared to the unfiltered halogen radiation (uHR). Data are calculated for fair skin assuming a plane parallel interface between air and skin and local invariance of the spectral coefficients of absorption and scattering, and of the refractive index [Citation35,Citation38,Citation39]. In panels A–C curve 1 represents wIRA, curve 2 shows uHR data. (A) Relative irradiance penetrating into tissue as a function of depth. (B) Cumulative absorbance as a function of tissue depth. (C) Relative absorbance as a function of tissue depth. Results are calculated by differentiation of the integral data in B using depth intervals of 0.1 mm. (D) The ratio of the penetrating (sub-surface) irradiances (curve 1) and the ratio of relative absorbances (curve 2) between wIRA and uHR as a function of depth.
![Figure 8. Optical characteristics of wIRA compared to the unfiltered halogen radiation (uHR). Data are calculated for fair skin assuming a plane parallel interface between air and skin and local invariance of the spectral coefficients of absorption and scattering, and of the refractive index [Citation35,Citation38,Citation39]. In panels A–C curve 1 represents wIRA, curve 2 shows uHR data. (A) Relative irradiance penetrating into tissue as a function of depth. (B) Cumulative absorbance as a function of tissue depth. (C) Relative absorbance as a function of tissue depth. Results are calculated by differentiation of the integral data in B using depth intervals of 0.1 mm. (D) The ratio of the penetrating (sub-surface) irradiances (curve 1) and the ratio of relative absorbances (curve 2) between wIRA and uHR as a function of depth.](/cms/asset/12e1177a-7f9e-456c-af7e-26eedb74053c/ihyt_a_1469169_f0008_c.jpg)
Table 1. Specific absorption rates (SAR) and flow rates derived from invasive temperature measurements in skin and subcutis of the lumbar region of human subjects during thermotherapy using the prototype wIRA radiator and thermographic control of the skin surface temperature [40].
Figure 9. SAR data as a function of tissue depth in three anaesthetized piglets exposed to wIRA using incident irradiances of 139 mW cm−2 (piglet 1) and of 113 mW cm−2 (piglets 2 and 3).
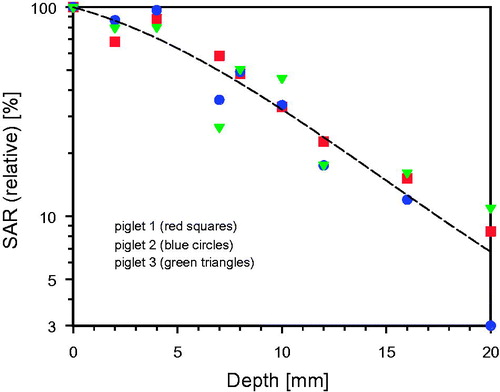
Figure 10. Skin surface temperature as a function of exposure time using a wIRA irradiance of 200 mW cm−2. (A) Temporally constant exposure of the backs of three healthy volunteers (1–3) without temperature control. (B) Controlled skin exposure by switching on/off according to the thermographic feedback signal (see Figure 2). In different treatments measurements were taken on normal skin (4), on lymphangitis carcinomatosa (5), on tumor tissue (6) and on tumor/scar tissue (7). Initial skin surface temperature of patients was slightly elevated due to activities in preparation of the treatment. No air ventilation, room temperature 22–24 °C.
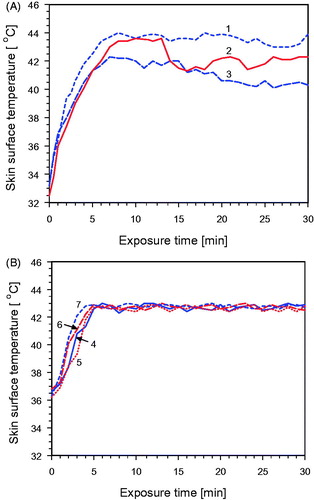
Figure 11. Mean temperature profile during wIRA exposure under steady-state conditions. Measured data in normal tissues [Citation49] (open squares), tumor tissues [Citation12] (open circles) and in recurrent breast cancers [Citation13] (solid triangles).
![Figure 11. Mean temperature profile during wIRA exposure under steady-state conditions. Measured data in normal tissues [Citation49] (open squares), tumor tissues [Citation12] (open circles) and in recurrent breast cancers [Citation13] (solid triangles).](/cms/asset/05f27010-7ada-404a-8d75-d70954f5d0c7/ihyt_a_1469169_f0011_c.jpg)
Figure 12. Mean tissue temperature profile upon 30 min wIRA exposure of three anaesthetized piglets (see Figure 9). Thickness of the skin: 4–5 mm, thickness of the fat layer: approx. 5 mm. The maximum tissue temperature exceeded surface skin temperature by about 1 K. Inter-individual variability of tissue temperature was in the range of ±1 K. Room temperature: 22–24 °C (no air ventilation).
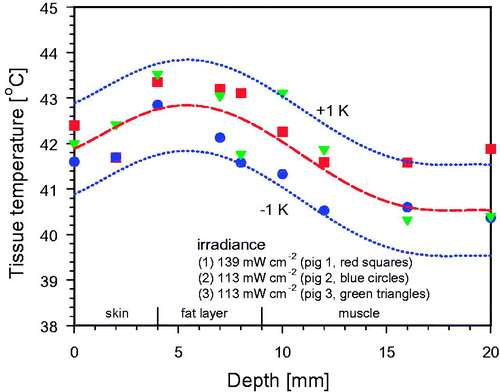
Figure 13. Temperature increase as a function of depth in a “wIRA-phantom” upon 6 min of exposure. Curve A: Incident irradiance 200 mW/cm2, corresponding to the standard distance of 33 cm between radiator and phantom surface. Curve B: Incident irradiance 92 mW/cm2, corresponding to a distance of 53 cm between radiator and phantom surface (for details see also Figure 4). Phantom temperature before wIRA exposure: 22.5±0.2 °C (no air ventilation).
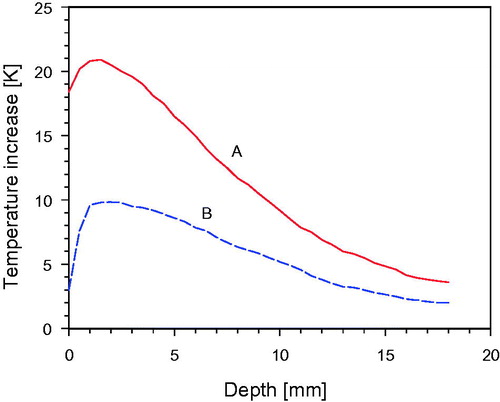
Figure 14. Vertical temperature profiles distributed across the entire cross-section with averaged depth temperature curve (bold). Standard distance between radiator and phantom surface: 33 cm, heating time: 6 min.
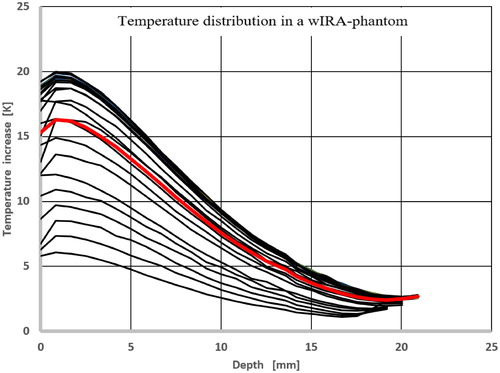
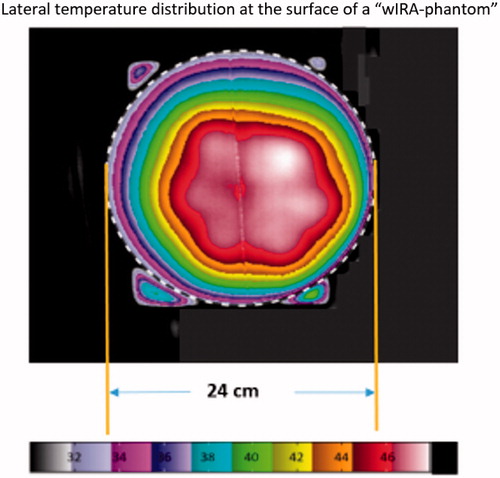
Figure 15. Lateral temperature distribution at the surface of the ‘wIRA-phantom’. The phantom edge is marked by the dotted line. Phantom height: 2 cm, heating time: 6 min. Slight asymmetries are caused by suboptimal positioning of the wIRA-radiator. The corresponding effective field size (EFS) according to the ESHO guidelines is determined to about 300 cm2, which equals a circular area with a diameter of 19.6 cm. The minimal temperature increase on the entire phantom surface is 5.0 K.