Figures & data
Figure 1. Schema of LH in this study. (A) Acrylic capsule into which the mouse is placed after anesthesia. The tumor-bearing legs were fixed to a plastic pole that was attached to the capsule. (B) local hyperthermia (LH) was performed by immersing the tumor-bearing leg in a constant-temperature circulating water bath at 42 °C for 60 min. (C) Schematic diagram of LH.
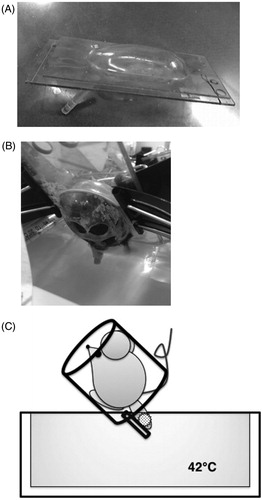
Figure 2. LH suppressed TG. Local hyperthermia (LH) suppressed the growth of E.G7-OVA tumors in C57BL/6J mice. Tumor growth (TG) curves of EG.7-OVA tumors in the control group (open circles; ^) and LH-treated group (open squares; □). Data are showed as the mean tumor volume ± SE and n = 8 per group. LH: local hyperthermia.
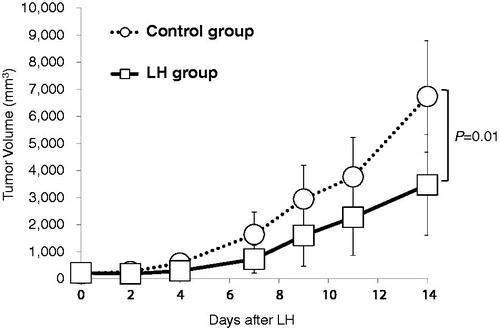
Figure 3. LH-induced tumor-specific splenocytes. To evaluate tumor-specific T cells induced by LH, ELISpot assays were performed using splenocytes obtained from mice from each group (n = 7 per group) as described in the Materials and Methods section. (A) Representative pictures of wells in the control and LH groups. Splenocytes were incubated with/without irradiated E.G.7-OVA. LH, local hyperthermia. (B) Data are reported as the mean number of spots ± SE of triplicate samples. Spot forming cells (SFC) were significantly increased in the LH group. Two-tailed, unpaired Student’s t-test was performed.
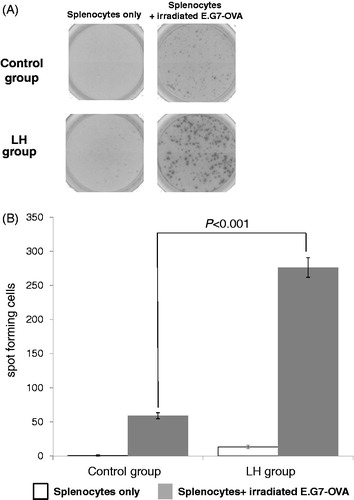
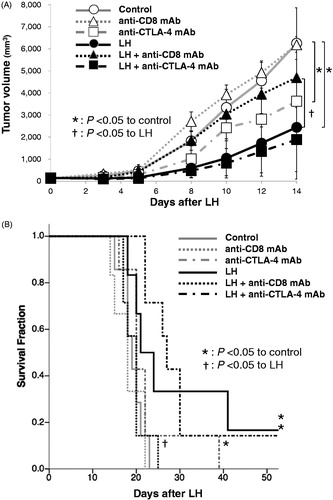
Figure 4. CD8 depletion reduced the therapeutic efficacy of LH on TG and survival in EG.7-OVA-bearing C57BL/6 mice, and the addition of anti-CTLA-4 mAb to LH did not amplify the therapeutic efficacy of LH. (A) TG curves of EG.7-OVA tumors in the control group (open circles; ^), LH-treated group (closed circles; •), anti-CD8 mAb-treated control group (open triangles; △), LH with anti-CD8 mAb-treated group (closed triangles; ▲), anti-CTLA-4 mAb-treated control group (open squares; □), and LH with anti-CTLA-4 mAb-treated group (closed squares; ▪). Data are shown as the mean tumor volume ± SE of seven mice per group. *p < .05 between control and anti-CTLA-4 mAb-treated group, and control and LH-treated group. †p < .05 between LH group and LH with anti-CD8 mAb-treated groups. (B) Survival curves of E.G7-OVA-bearing C57BL/6J mice in the control group (gray solid line), LH-treated group (black solid line), anti-CD8 mAb-treated control group (gray dotted line), LH with anti-CD8 mAb-treated group (black dotted line), anti-CTLA-4 mAb-treated control group (gray dashed line), and LH with anti-CTLA-4 mAb-treated group (black dashed line). (n = 7 per group) *p < .05 for control, and †p < .05 for the LH-treated group.