
Figures & data
Figure 1. Flowchart showing selection of the articles.
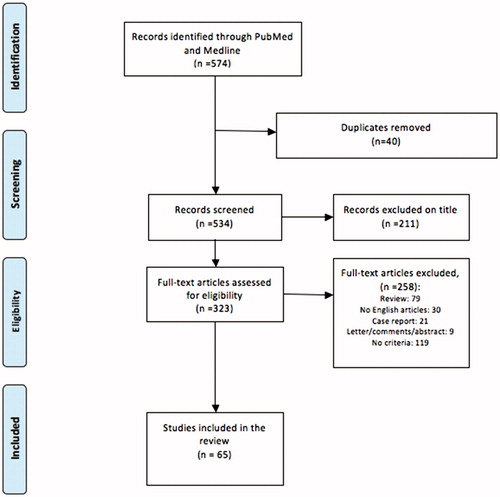
Figure 2. Laser Ablation: (A) schematisation of the EUS-guided LA; (B) right side, during EUS-guided LA, the hyperechoic spot visible close to the needle tip, inside the tumour (arrow); left side, at the end of the procedure, EUS showed a hyperechoic area along the path of the probe surrounded by nonhomogeneous tissue with hyperechoic spots. Reprinted from [31] Copyright 2018, with permission from Elsevier. (C) H&E Histology of the lesion induced by Nd:YAG laser on in vivo healthy pig. (D) Schematization of nanoparticles-mediated LA.
![Figure 2. Laser Ablation: (A) schematisation of the EUS-guided LA; (B) right side, during EUS-guided LA, the hyperechoic spot visible close to the needle tip, inside the tumour (arrow); left side, at the end of the procedure, EUS showed a hyperechoic area along the path of the probe surrounded by nonhomogeneous tissue with hyperechoic spots. Reprinted from [31] Copyright 2018, with permission from Elsevier. (C) H&E Histology of the lesion induced by Nd:YAG laser on in vivo healthy pig. (D) Schematization of nanoparticles-mediated LA.](/cms/asset/718146e8-b1cb-4544-8079-d668fa610ee9/ihyt_a_1506165_f0002_c.jpg)
Table 1. Laser Ablation in preclinical and ex vivo settings.
Figure 3. Radiofrequency Ablation: A) Measurement of Hounsfield Unit value of the RFA induced lesion in pancreatic adenocarcinoma and B) of the necrotic area. Reprinted from [Citation43] Copyright 2018, with the permission of Pioneer Bioscience Publishing Company. C) Gross pathology of the porcine RF-ablated pancreas. D) Hystological image of the thermal outcome: coagulated necrosis, fibrous tissue and normal pancreatic parenchyma. (H&E, orig. mag. x40). Reprinted from [Citation39] Copyright 2018, with the permission of Elsevier.
![Figure 3. Radiofrequency Ablation: A) Measurement of Hounsfield Unit value of the RFA induced lesion in pancreatic adenocarcinoma and B) of the necrotic area. Reprinted from [Citation43] Copyright 2018, with the permission of Pioneer Bioscience Publishing Company. C) Gross pathology of the porcine RF-ablated pancreas. D) Hystological image of the thermal outcome: coagulated necrosis, fibrous tissue and normal pancreatic parenchyma. (H&E, orig. mag. x40). Reprinted from [Citation39] Copyright 2018, with the permission of Elsevier.](/cms/asset/d937d70e-1d33-46fc-b715-f5366aa40b28/ihyt_a_1506165_f0003_c.jpg)
Table 2. Radiofrequency Ablation in preclinical and ex vivo settings.
Table 3. Radiofrequency Ablation in clinical settings. PA: pancreatic adenocarcinoma; NT: neuroendocrine tumour.
Figure 4. Microwave Ablation: A) Schematization of the MWA guided with the percutaneous. approach; B) US-image guided MWA (white arrow indicates the antenna); C) Sagittal CT view in a patient with internal/external biliary drainage (black arrow) showing the MWA antenna (white arrow) deployed a few millimetres away from the drain. Reprinted from [Citation65] Copyright 2018, with the permission of Elsevier.
![Figure 4. Microwave Ablation: A) Schematization of the MWA guided with the percutaneous. approach; B) US-image guided MWA (white arrow indicates the antenna); C) Sagittal CT view in a patient with internal/external biliary drainage (black arrow) showing the MWA antenna (white arrow) deployed a few millimetres away from the drain. Reprinted from [Citation65] Copyright 2018, with the permission of Elsevier.](/cms/asset/56540158-eecd-4fa8-889a-c3a64d825bf8/ihyt_a_1506165_f0004_c.jpg)
Figure 5. HIFU: (A) Schematization of HIFU procedure; (B) Volume ratio changes (tumour volume at day 28/tumour volume at day 0) with weekly treatment of PANC-1 xenografts in BALB/c nude mice with HIFU and/or gemcitabine (GEM). Reprinted from [Citation71] Copyright 2018, with the permission of Elsevier. (C) MR-guided HIFU treatment planning of the pancreatic cancer with the patient placed in the supine position over the US transducer (t): image shows liver (l), spleen (s), right kidney (k), and abdominal aorta (a), as well as the predicted ultrasound beam path (triangles) with the focal spot placed over the target lesions (rectangular box). (D) PRF shift-weighted image for MR thermometry demonstrate increase of tissue temperature in the focal spot area (up to about 80 °C) as well as heat distribution beyond the target zone (up to 95 °C), along the abdominal aorta and within the coeliac plexus. (E) Temperature chart shows increase of tissue temperature during sonication in the target area. Reprinted from [75] Copyright 2018, with the permission of Springer.
![Figure 5. HIFU: (A) Schematization of HIFU procedure; (B) Volume ratio changes (tumour volume at day 28/tumour volume at day 0) with weekly treatment of PANC-1 xenografts in BALB/c nude mice with HIFU and/or gemcitabine (GEM). Reprinted from [Citation71] Copyright 2018, with the permission of Elsevier. (C) MR-guided HIFU treatment planning of the pancreatic cancer with the patient placed in the supine position over the US transducer (t): image shows liver (l), spleen (s), right kidney (k), and abdominal aorta (a), as well as the predicted ultrasound beam path (triangles) with the focal spot placed over the target lesions (rectangular box). (D) PRF shift-weighted image for MR thermometry demonstrate increase of tissue temperature in the focal spot area (up to about 80 °C) as well as heat distribution beyond the target zone (up to 95 °C), along the abdominal aorta and within the coeliac plexus. (E) Temperature chart shows increase of tissue temperature during sonication in the target area. Reprinted from [75] Copyright 2018, with the permission of Springer.](/cms/asset/0a764a4e-eb7d-4d3e-9ca5-43d00e6fe692/ihyt_a_1506165_f0005_c.jpg)
Table 4. HIFU in preclinical and ex vivo settings.
Table 5. HIFU in clinical settings.
Figure 6. Cryoablation. Hyperechoic line along the path of the probe surrounded by nonhomogeneous tissue with hyperechoic spots. T, tumour; SMA, superior mesenteric artery. Reprinted from [Citation103] Copyright 2018, with the permission of Elsevier.
![Figure 6. Cryoablation. Hyperechoic line along the path of the probe surrounded by nonhomogeneous tissue with hyperechoic spots. T, tumour; SMA, superior mesenteric artery. Reprinted from [Citation103] Copyright 2018, with the permission of Elsevier.](/cms/asset/09a8e2b4-2c01-4bb8-8dcd-c047efe04ec1/ihyt_a_1506165_f0006_c.jpg)
Table 6. Hybrid and new ablation techniques in preclinical and ex vivo settings.