Figures & data
Figure 1. ‘Slow’ hyperthermic thermal exposure of cells achieved using a PCR thermal cycler. 60 μL of cells in a medium in plastic walled PCR tubes were placed in individual wells with the heating block. Thermocouples connected to a data logger were used to record temperature with one thermocouple per tube. The thermal dose was delivered using the range of heating cycles detailed in .
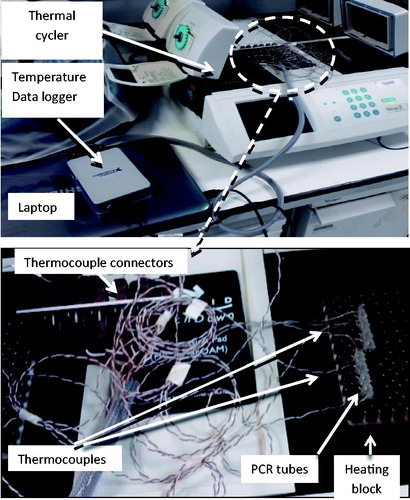
Table 1. Biorad Tetrad2 DNA Engine PCR thermal cycler specifications.
Table 2. Details of ‘slow’ hyperthermic thermal exposures averaged over 5 experiments achieved using the PCR thermal cycler as the heating source.
Figure 2. ‘Rapid’ ablative thermal dose delivery. (A) indicates how 5 K-type thermocouples were positioned in the pre-heated medium. Also shown is roughly where the cells were pipetted into the pre-heated solution for an intended exposure of 57 °C for 3 s. (B and C) show typical examples of the temperature histories measured for such an exposure which was intended to provide a minimum TID of 820 CEM43. The resultant exposures are summarized in terms of thermal dose and peak temperature in .
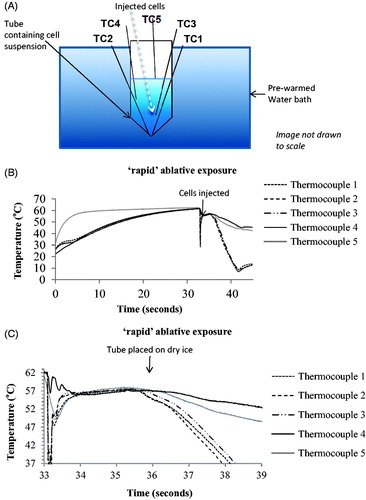
Figure 3. Average viability of HCT116 and HT29 colon cancer cells assessed up to 14 days after ‘slow’ hyperthermic exposures with TIDs of 0, 120, 240, 480 and 720 CEM43 achieved using 37 °C, 46 °C, 47 °C, 48 °C for 15 min and 49 °C for 11 min and 15 s, respectively. Results are presented as means ± SEM for three independent experiments per data point.
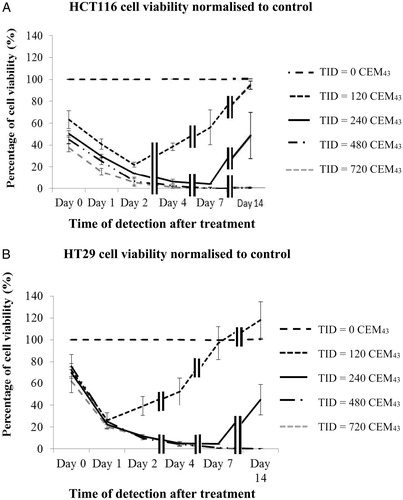
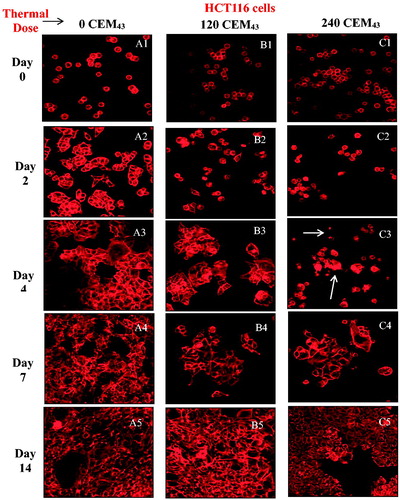
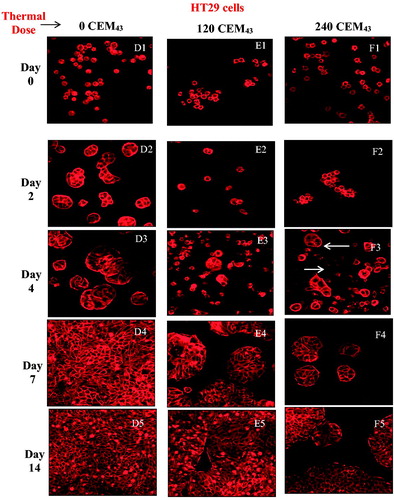
Figure 5. Comparison of cell viability for different ‘slow’ hyperthermic thermal exposure regimes. HCT116 and HT29 cell viability treated with a TID of 120 CEM43 (A) and 240 CEM43 (B) and assessed 1 day after treatment using the combinations of time and temperature shown in each graph. Results are presented as means ± std. dev. (n = 4) of an experiment that has been repeated three times with similar results. The data show that cell viability was independent of the delivery strategy over the range tested.
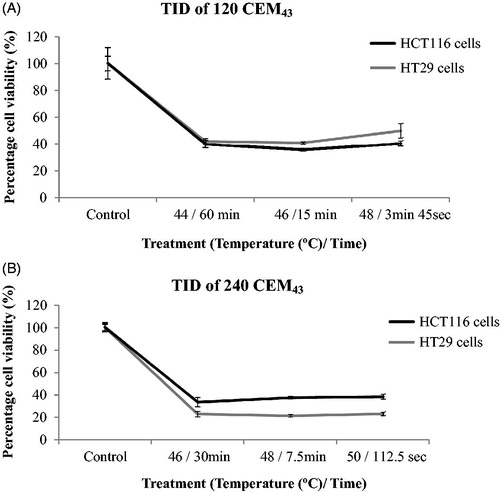
Figure 6. Comparison of cell viability following ‘rapid’ ablative and ‘slow’ hyperthermic thermal exposures. Ten days after treatment, the viability of HCT116 (A) and HT29 (B) cells treated with ‘rapid’ ablative exposures (quantified as minTID) was greater than that for cells treated with ‘slow’ hyperthermic thermal exposures (quantified as average TID). Results are presented as means ± std. dev. of two datasets from a single experiment that has been repeated 3 times with similar results.
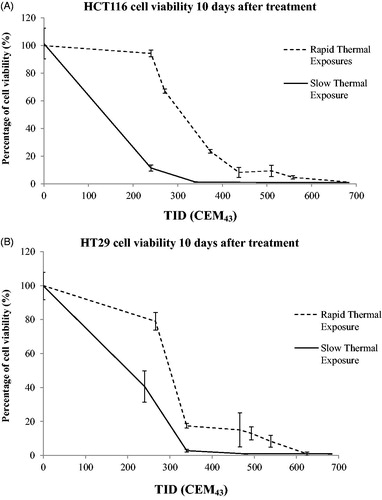
Table 3. ‘Rapid’ ablative thermal exposures: the intended thermal dose, total exposure duration (recorded by the lowest placed thermocouple (tc 1), plus peak temperature and local TID calculated from 5 thermocouples are shown.
Table 4. ‘Rapid’ ablative thermal exposures: the duration of, minimum TID accumulated in, and percentage of the total minTID in, each phase (increasing temperature, steady-state temperature, and reducing temperature) of the treatment as recorded by the lowest placed thermocouple (tc 1) for each test.
Figure 7. Arrhenius plot of both ‘slow’ hyperthermic and ‘rapid’ ablative exposures for HCT116 and HT29 cells (A). The cell injury rate was calculated for both ‘slow’ hyperthermic exposures shown in figure 5 and the ‘rapid’ ablative treatments in figure 6. A comparison of the experimentally detected cell survival to that calculated using the Arrhenius kinetic parameters ΔE and A, and EquationEquations 3(Equation 3)
(Equation 3) and Equation4
(Equation 4)
(Equation 4) (B) is shown.
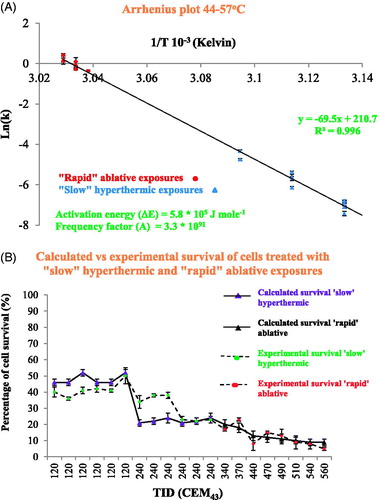
Table 5. Calculation of cell injury rate and comparison of cell survival predicted by the Arrhenius model with that measured experimentally: the temperature and duration (assuming top-hat thermal histories) of ‘slow’ hyperthermic and ‘rapid’ ablative exposures have been used to calculate the cell injury rate.
Figure 8. The dependence of RCEM on temperature. RCEM was calculated using EquationEquation (7)(Equation 7)
(Equation 7) and the activation energy values obtained from the Arrhenius plot and plotted as a function of temperature.
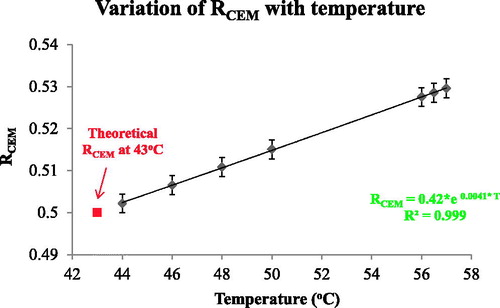
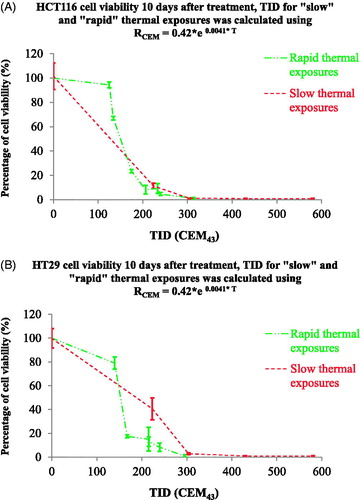
Figure 9. Comparison cell viability following ‘rapid’ ablative and ‘slow’ hyperthermic exposures using a temperature-dependent RCEM to calculate the TID. The results of figure 6 were replotted using a TID calculated with RCEM=0.42 × e0.0041 × T (EquationEquation (7)(Equation 7)
(Equation 7) . Cell viability is undetectable for both heating strategies when TID >305 + 10 CEM43.