Figures & data
Figure 1. Schematic representation of the magnetic field applied to the cells with MNFs.
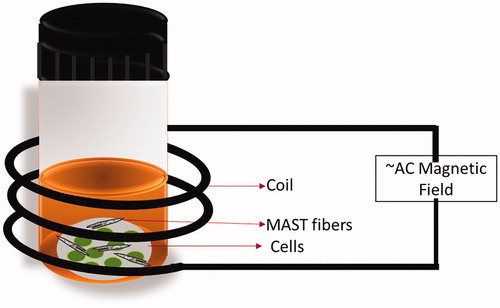
Figure 2. (a) Representative SEM image of MNFs (inset: Magnetic nanofibrous mat), (b) MNFs after AMF exposure for 15 min, (c) heating profile of MNFs (10 mg/ml) in PBS in the presence of AMF (3.6 kA/m, 236 kHz) and (d) drug release profile from the MNFs.
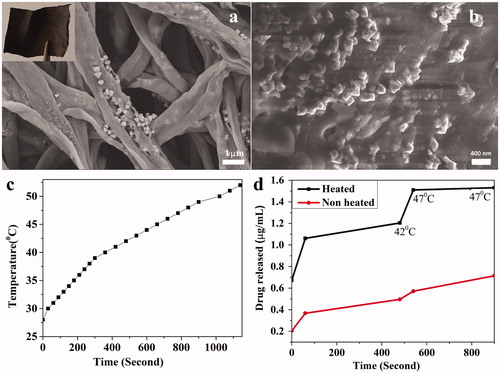
Figure 3. Representative fluorescence images of HeLa cells grown on (a) TCPS, (b) MNFs for 24 h, hMSCs cells grown on (c) TCPS, (d) MNFs for 48 h. SEM images of (e) HeLa cells and (f) hMSCs cells grown on MNFs. The viability of HeLa cell after 24 h and hMSCs after 48 h grown on MNFs.
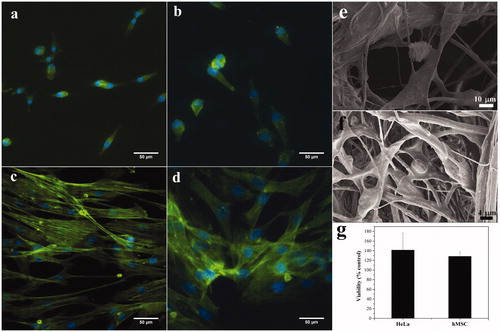
Figure 4. Effect of AC magnetic field (AMF) and drug release on C. albicans cells. (a) Minimum inhibitory concentration (MIC) curve (b) viability of C. albicans cells. Samples were subjected to AMF for 15 min. Without AMF/without drug, the cfu counts are statistically significant when compared to with AMF/without drug (p = .0049 at 47 °C and p = .0006 at 50 °C). Also, without AMF/with drug cfu counts are statistically significant when compared to with AMF/with drug (p = .0001 at 47 °C and 50 °C), (c) HeLa cell viability of AMF exposure. Error bar represents mean ± SE. *Shows the significant difference at p ≤ .05 w.r.t. control and (d) vital staining of C. albicans cells by propidium iodide (PI). Control and test samples were stained with PI to score for live–dead C. albicans cells. Scale bar 6 μm.
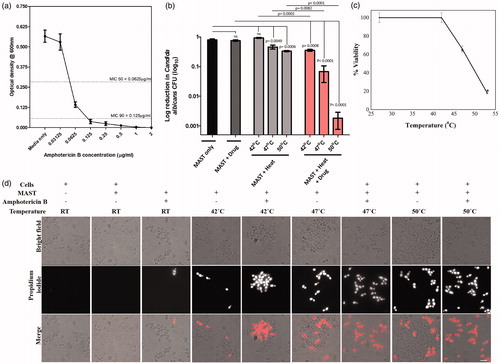
Figure 5. Stability of amphotericin B at higher temperature. Error bar represents mean ± SE.
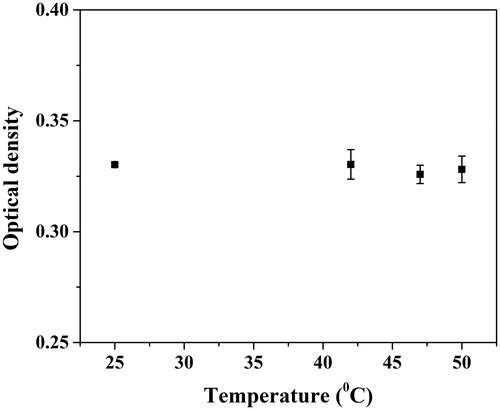
Figure 6. Cumulative equivalent minutes at 43 °C (CEM 43).
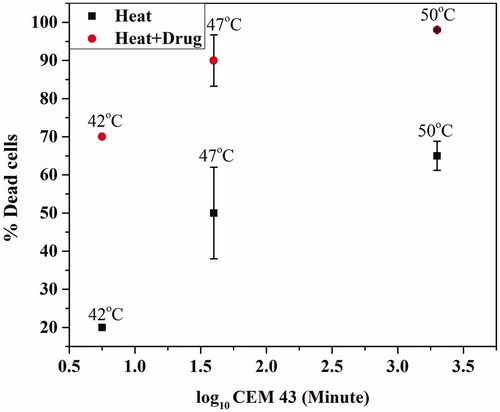
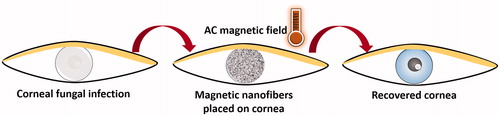
Figure 7. Schematic of the corneal infection treatment using MNFs.