Figures & data
Figure 1. (A) Schematic of experimental design. Luciferin containing 4T1-cells were injected in the fourth mammary fat pad of female BALB/c mice seven days before treatment. Three days after tumor implantation, tumors were measurable and the growth of the primary tumor was measured until the end of the experiment. On day of treatment (D0), primary tumors were treated with local RT ± HT (HTM: mild or HTAbl partially ablative). Mice were sacrificed at D0, D7 and D14. Primary tumors and organs were harvested for staining of particular cell types or to identify the number of metastases. Thermometry measurements of mild vs. partially ablative hyperthermia. Graphs represent thermometry data of (B) HTM, heating at 43 °C for 20 min and (C) HTAbl, heating at 45 °C for 5 min plus 43 °C for 15 min. (D) Almost two times higher CEM43 is measured after HTAbl vs. HTM. (E) Maximum temperatures reached are higher after HTM compared to HTAbl.
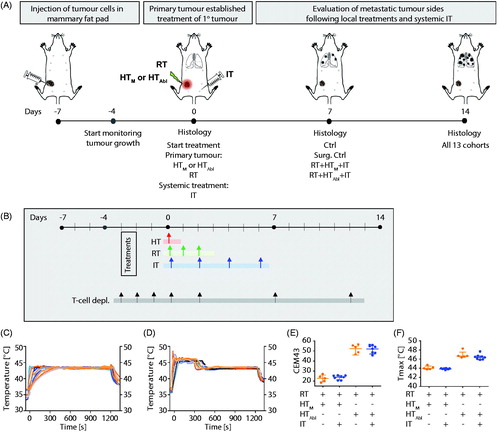
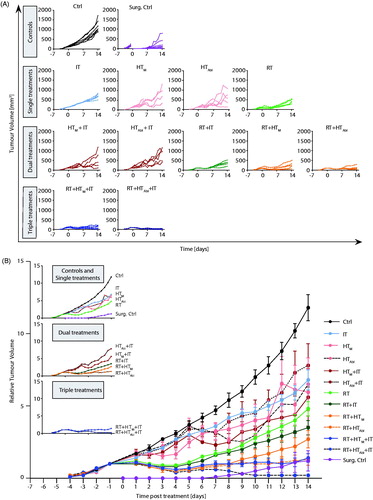

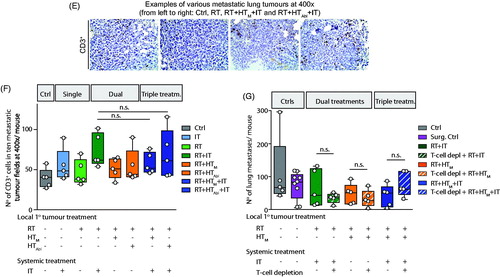
Figure 3. Effects of treatment on the primary tumor at day 14 post-treatment. (A) Representative images of hematoxylin-eosin (H&E) stained tumor tissue sections demonstrating large necrotic areas after any treatment including RT. (B) Representative sections of tumor stained with and CD3 antibody for immunohistochemical analysis of CD3+ T-lymphocytes infiltration into primary tumors after treatment. (C) Scatter plot of enumerated CD3+ cells showing a progressive increase of T-lymphocyte infiltration into tumors resulting from therapy. A higher number of CD3+ cells was observed in tumors following RT + HTAbl and RT + IT + HTM and RT + IT + HTAbl. As in , horizontal bars identify median values and boxes define interquartile range with whiskers marking minimum and maximum for all groups.
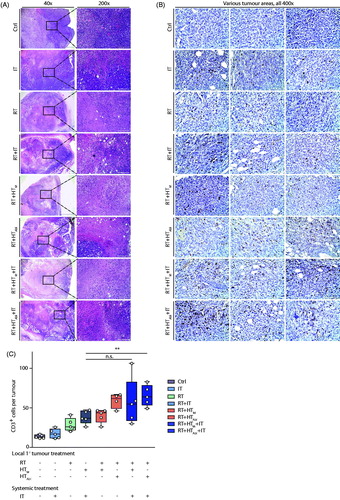
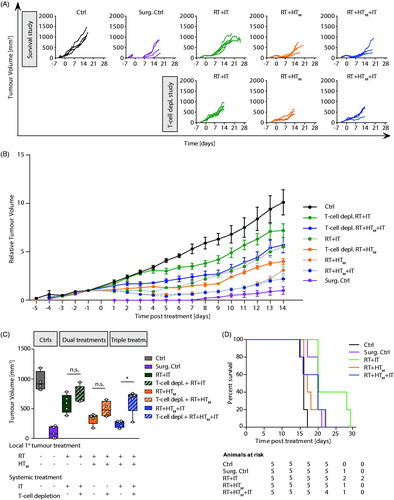
Figure 4. Growth of primary tumors after focal RT and HT combined with systemic immune checkpoint inhibitors compared with pharmacologic T-cell inhibition. (A) As in , growth of individual tumors after treatment with RT, HTM and IT, compared with tumor volumes measured on mice after treatment and with pharmacologic T-lymphocyte inhibition. Mice were treated on Day 0. (B) As in A but data points represent mean tumor volume and error bars the standard error. (C) Scatter plot of tumor volumes measured at 14 days after treatment and at euthanasia. Horizontal bars identify median values and boxes define interquartile range with whiskers marking minimum and maximum for all groups. (D) Kaplan–Meier representation of results of pilot survival study. Despite evidence of improved local tumor control with combination therapy and evidence of increased trafficking of T-lymphocytes to tumors, no improvement in survival was measured. All cohorts had at least five mice.