Figures & data
Figure 1. MSCs lose their proliferative ability but remain viable after hyperthermia. (A) Clonogenic survival assays for human MSCs and NHDFs. (B) Proliferation at 96 h after hyperthermia therapy of MSCs and NHDFs. (C) Resazurin assays at 96 h after hyperthermia. *p < 0.05, ***p < 0.001. Data are presented as mean ± standard deviation.
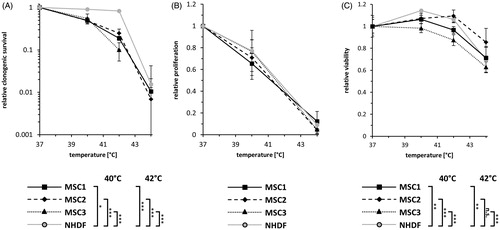
Figure 2. MSCs show delayed cellular adhesion but unaltered velocity after hyperthermia. (A) Relative adhesion rate of MSCs and NHDFs after exposure to 37 °C or 42 °C for 60 min. (B) Average cellular motility of hyperthermia-exposed MSCs and NHDFs determined by time-lapse microscopy. Date are shown as mean ± standard deviation. *p < 0.05, **p < 0.01, ***p < 0.001.
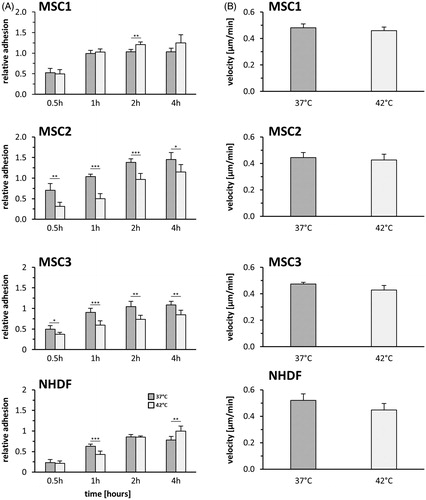
Figure 3. MSCs largely retain their characteristic surface marker pattern but show morphological alterations after hyperthermia. (A) Flow cytometry analyses of positive (CD73, CD90 and CD105) and negative (CD14, CD20, CD34 and CD45) MSC surface markers at 96 h after hyperthermia. (B) Representative phase contrast images showing cellular morphology of MSCs and NHDFs at 96 h after hyperthermia with 42 °C. 10× objective, scale bar 100 µm.
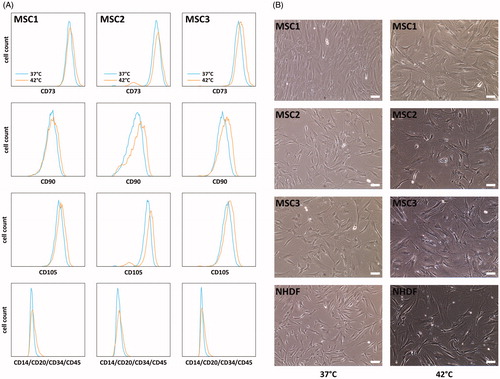
Figure 4. Hyperthermia reduces adipogenic differentiation but enhances osteogenic differentiation potential of MSCs. (A) Adipogenic differentiation after exposure to 37 °C, 40 °C and 42 °C quantified by BODIPY® 493/503 staining. 2× objective, scale bar 1000 µm. (B) OsteoImageTM staining for assessment of hydroxyapatite amount as marker for osteogenic differentiation after hyperthermia. 10× objective, scale bar 200 µm. (C) Chondrogenic differentiation after hyperthermia determined by aggrecan staining. 10× objective, scale bar 200 µm. *p < 0.05, **p < 0.01, ***p < 0.001.
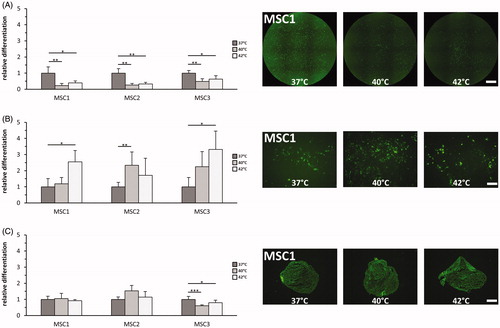
Figure 5. MSCs exhibit a prolonged G2/M-phase arrest after hyperthermia. (A) Cell cycle distribution at different time points after hyperthermia therapy. Representative DAPI histograms show cell cycle distribution. *p < 0.05, **p < 0.01, ***p < 0.001.
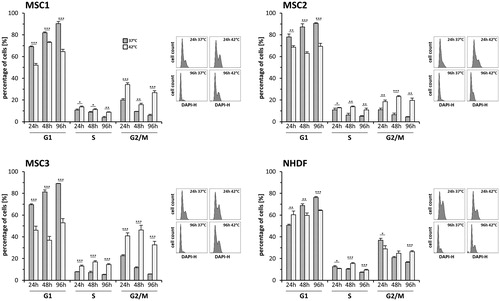
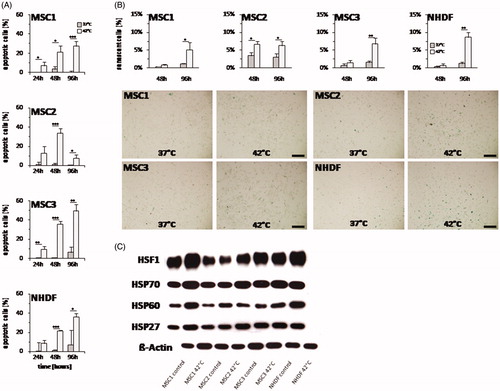
Figure 6. Hyperthermia leads to both increased apoptosis and senescence levels in MSCs. (A) Percentage of apoptotic MSCs and NHDFs determined by levels of activated caspase-3 at 24, 48 and 96 h after hyperthermia with up to 42 °C. (B) Percentage of senescent cells assessed by β-galactosidase staining at 48 and 96 h after hyperthermia. Representative images showing β-galactosidase staining of hyperthermia-treated MSCs and NHDFs. 10× objective, scale bar 200 µm. (C) Western Blot analyses of HSF1, HSP70, HSP60 and HSP27 at 24 h after hyperthermia treatment in MSCs and NHDFs. β-actin was used as loading control. *p < 0.05, **p < 0.01, ***p < 0.001.