Figures & data
Table 1. Primers used for the detection of transcripts.
Figure 1. (a, b) Cell viability of 4T1 and EMT-6 cells after treatment at 43 °C determined using MTT assay. The cell viability of untreated cells was considered as 100%. (c, d) Cell viability of 4T1 and EMT-6 using Annexin V-FITC-PI-based FACS at CEM43 TD50 [Individual replicate data provided in Supplementary Figure S3].
![Figure 1. (a, b) Cell viability of 4T1 and EMT-6 cells after treatment at 43 °C determined using MTT assay. The cell viability of untreated cells was considered as 100%. (c, d) Cell viability of 4T1 and EMT-6 using Annexin V-FITC-PI-based FACS at CEM43 TD50 [Individual replicate data provided in Supplementary Figure S3].](/cms/asset/7663b26b-ca59-4cd5-94f2-36996943a7be/ihyt_a_1778800_f0001_c.jpg)
Table 2. Thermal dose50 (TD50) for EMT-6, 4T1, and RAW 264.7 cells after treatment at different temperatures and their CEM43 Thermal Dose50 (CEM TD50) equivalents.
Figure 2. NTA analysis of isolates of 4T1 and EMT-6 derived exosomes. (a, c) Data represents the number of exosomes obtained from isolation replicates (n = 3, p = 0.0376 for 4T1, p = 0.0174 for EMT-6). The exosome yield reported here has been standardized to exosomes per 107 viable cells at the time of exosome isolation. (b, d) Data represents the average size distribution profile from isolation replicates (n = 3). Student’s t-test was used for comparing data between the two groups. [Individual replicate data provided in Supplementary Figure S-4, S-5].
![Figure 2. NTA analysis of isolates of 4T1 and EMT-6 derived exosomes. (a, c) Data represents the number of exosomes obtained from isolation replicates (n = 3, p = 0.0376 for 4T1, p = 0.0174 for EMT-6). The exosome yield reported here has been standardized to exosomes per 107 viable cells at the time of exosome isolation. (b, d) Data represents the average size distribution profile from isolation replicates (n = 3). Student’s t-test was used for comparing data between the two groups. [Individual replicate data provided in Supplementary Figure S-4, S-5].](/cms/asset/9db4c29c-db71-4a96-bba7-c3e19acaae68/ihyt_a_1778800_f0002_b.jpg)
Table 3. Exosome size in EMT-6 or 4T1-derived control and hyperthermia-treated sets.
Figure 3. TEM images of negatively stained exosomes. (a) 4T1 control exosomes, (b) 4T1 exosomes posthyperthermia treatment, (c) EMT-6 control exosomes, and (d) EMT-6 exosomes posthyperthermia treatment. Yellow arrows signify the presence of relatively larger exosomes observed in greater abundance in hyperthermia-based treated sets.
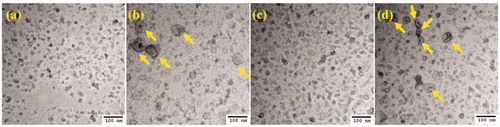
Figure 4. (a) Bright-field images of transwell migration of RAW 264.7 cells upon treatment with LPS (positive control), EMT-6 control exosomes, EMT-6 exosomes posthyperthermia treatment, 4T1 control exosomes, and 4T1 exosomes posthyperthermia treatment. (b) Transwell migratory profile of RAW 264.7 macrophages upon treatment with LPS (positive control), EMT-6 control exosomes, EMT-6 exosomes posthyperthermia treatment, 4T1 control exosomes, and 4T1 exosomes posthyperthermia treatment. Each bar represents the mean ± standard error (n = 3). One-way ANOVA followed by Tukey’s test was used for comparing data between groups, where *** indicates p < 0.001 between bracketed groups.
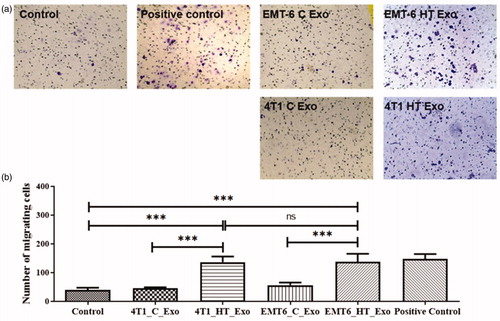
Figure 5. (i) SEM images of (a) Untreated negative control, (b) Positive control (LPS-treated), (c, e) control exosome-treated and (d, f) hyperthermia derived exosome treated RAW 264.7 cells (scale bar represents 10 μm), (ii) Percentage of flattened cells in positive control, posthyperthermia derived exosome treated RAW 264.7 cells compared to respective controls after 24 h treatment. Each bar represents the mean ± standard deviation with sample size (number of counted cells) >50. The student’s t-test was used for comparing data between the two groups (n = 3), where * indicates p < 0.05.
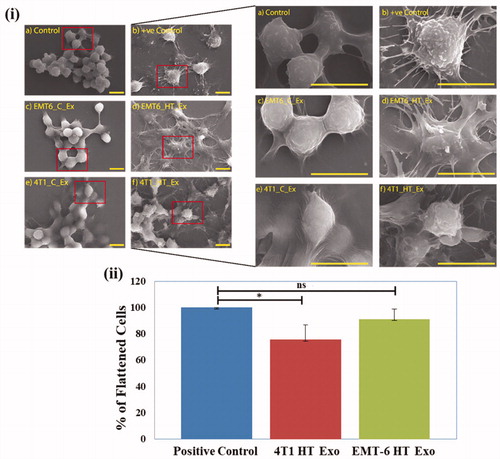
Figure 6. Western blot analysis of Hsp70, CD9, CD63 proteins in exosomes from control untreated or hyperthermia treated EMT-6 and 4T1 cells with individual densitometry analysis. Each bar represents the mean optical density ± standard error (n = 3). The student’s t-test was used for comparing data between the two groups (n = 3), where * indicates p < 0.05. The green arrow in (a) represents increased expression (signal intensity).
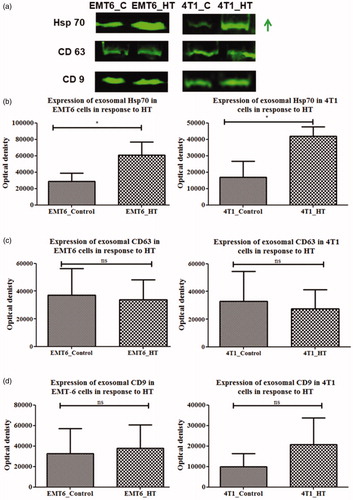
Figure 7. Untreated or hyperthermia based exosome-mediated alterations in inflammatory or downstream signaling pathways as observed in RAW 264.7 macrophages. Each bar represents the mean concentration ± standard error (n = 3). One-way ANOVA followed by Tukey’s test was used for comparing data between groups, where * indicates p < 0.05, ** indicates p < 0.01, and *** indicates p < 0.001 between bracketed groups.
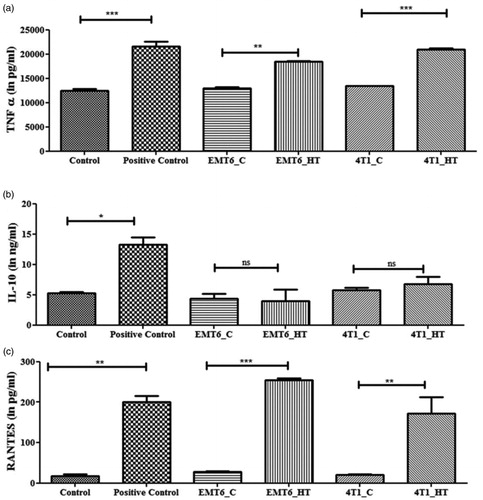
Figure 8. qRT-PCR profile of macrophage polarization marker expression (normalized to GAPDH) in RAW 264.7 after 24 h exposure to control and hyperthermia based exosomes from 4T1 and EMT-6 cells, respectively. One-way ANOVA followed by Tukey’s test was used for comparing data between groups, where * indicates p < 0.05, ** indicates p < 0.01, and *** indicates p < 0.001 between bracketed groups (n = 3).
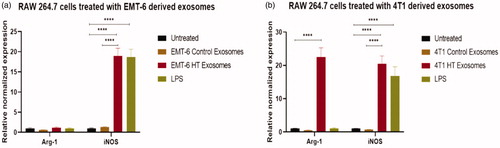
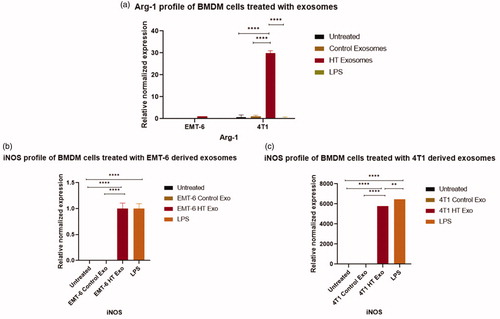
Figure 9. qRT-PCR profile of macrophage polarization marker expression (normalized to GAPDH) in BMDMs following the exposure to control exosomes or exosomes derived from 4T1 and EMT-6 cells exposed to hyperthermia. (a) Arg-1 profile of BMDM cells following 24 h exposure to control and hyperthermia-based exosomes from 4T1 and EMT-6 cells, respectively, (b, c) iNOS profile of BMDM cells after 24 h exposure to control exosomes or exosomes derived from 4T1 and EMT-6 cells exposed to hyperthermia. The Arg-1 and iNOS expression level in untreated control and EMT-6 control exosomes treated BMDM cells in (a,b) is close to zero and hence not visible in the graph. Similarly iNOS expression level is negligible in untreated control and 4T1 control exosome treated BMDM cells in (c) and hence not visible in the graph. One-way ANOVA followed by Tukey’s test was used for comparing data between groups, where * indicates p < 0.05, ** indicates p < 0.01 and *** indicates p < 0.001 between bracketed groups (n = 3).