
Figures & data
Figure 1. Spectral irradiance of the wIRA-irradiator (type: hydrosun 750, hydrosun, Müllheim, Germany) equipped with a cutoff filter (type BTE 595, BTE Elsoff, Germany) as a function of wavelength. Measurements were performed at longitudinal distances between the center of the irradiator exit window and the center of the entrance window of the spectroradiometer of 37 cm. Both windows were parallel to each other.
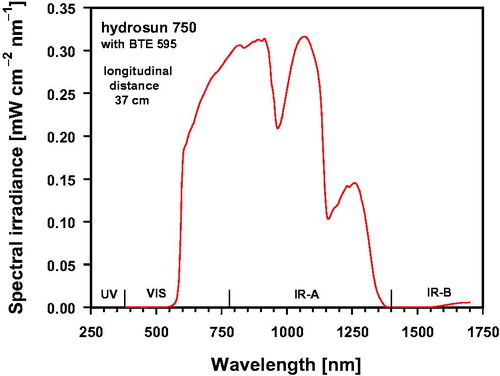
Figure 2. Relative irradiance (%) as a function of the lateral distance to the center, normalized to the value measured at the center of the irradiated area (longitudinal distance of 37 cm).
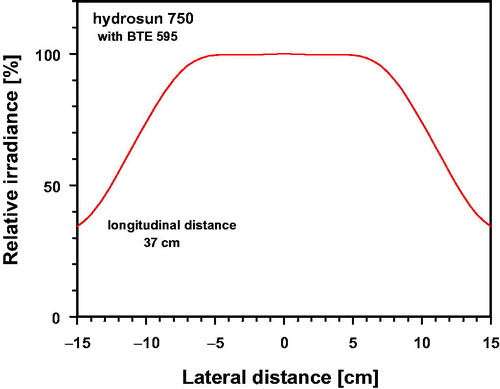
Table 1. Individual thicknesses of skin and fat layers, and body core temperature of piglets before and immediately after wIRA-irradiation.
Figure 3. Template for sensor positions and tissue depths at which temperature measurements were performed (left), marked target field with inserted temperature sensors (right). The sensors were inserted through catheters (type: SURFLO IV Catheter and SUPERFLASH IV Catheter, TERMURO, Tokyo, Japan).
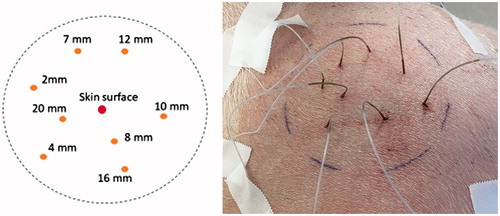
Figure 4. Heating rate assessed in vivo as a function of tissue depth in the upper thigh of piglets exposed to wIRA using an irradiance of 126.5 mW cm−2 (IR-A). Data: mean values and standard deviations. Curve fit using polynominal regression (diamonds, curve 1). Results are compared with published data from preliminary in vivo-measurements in human abdominal wall (stars, [Citation33]), and in recurrent breast cancer (dots, [Citation13,Citation17]) during wIRA skin exposure with 146.2 mW cm−2 (IR-A).
![Figure 4. Heating rate assessed in vivo as a function of tissue depth in the upper thigh of piglets exposed to wIRA using an irradiance of 126.5 mW cm−2 (IR-A). Data: mean values and standard deviations. Curve fit using polynominal regression (diamonds, curve 1). Results are compared with published data from preliminary in vivo-measurements in human abdominal wall (stars, [Citation33]), and in recurrent breast cancer (dots, [Citation13,Citation17]) during wIRA skin exposure with 146.2 mW cm−2 (IR-A).](/cms/asset/aae314df-3f94-4fdc-a5ec-21db8d9a470e/ihyt_a_1792562_f0004_c.jpg)
Figure 5. Absolute (a) and relative values (b) of SAR assessed in vivo as a function of tissue depth in the upper thigh of piglets exposed to wIRA irradiance using 126.5 mW cm−2 (IR-A). Data: mean values and standard deviations. Curve fit using polynominal regression (diamonds, curve 1). Results are compared with published data from preliminary in vivo-measurements in human abdominal wall (stars, [Citation33]), and in recurrent breast cancer (dots, [Citation13,Citation17]) during wIRA skin exposure with 146.2 mW cm−2 (IR-A).
![Figure 5. Absolute (a) and relative values (b) of SAR assessed in vivo as a function of tissue depth in the upper thigh of piglets exposed to wIRA irradiance using 126.5 mW cm−2 (IR-A). Data: mean values and standard deviations. Curve fit using polynominal regression (diamonds, curve 1). Results are compared with published data from preliminary in vivo-measurements in human abdominal wall (stars, [Citation33]), and in recurrent breast cancer (dots, [Citation13,Citation17]) during wIRA skin exposure with 146.2 mW cm−2 (IR-A).](/cms/asset/97a3ddde-d22d-4259-8cd2-4a57703d3164/ihyt_a_1792562_f0005_c.jpg)
Figure 6. Temperature rise measured in vivo as a function of tissue depth in the upper thigh of piglets during wIRA exposure with an irradiance of 126.5 mW cm−2 (IR-A) after 6 min of exposure (a) and after achieving thermal steady state (b). The dotted line indicates the temperature rise TR = 6 K as required by ESHO for adequate heating [Citation1]. Data: mean values and standard deviations (diamonds). Curve fit using polynominal regression. Results are compared with published data from preliminary in vivo-measurements in human abdominal wall exposed to 146.2 mW cm−2 of wIRA (IR-A) during thermal steady state (stars, [Citation33]) (b).
![Figure 6. Temperature rise measured in vivo as a function of tissue depth in the upper thigh of piglets during wIRA exposure with an irradiance of 126.5 mW cm−2 (IR-A) after 6 min of exposure (a) and after achieving thermal steady state (b). The dotted line indicates the temperature rise TR = 6 K as required by ESHO for adequate heating [Citation1]. Data: mean values and standard deviations (diamonds). Curve fit using polynominal regression. Results are compared with published data from preliminary in vivo-measurements in human abdominal wall exposed to 146.2 mW cm−2 of wIRA (IR-A) during thermal steady state (stars, [Citation33]) (b).](/cms/asset/2d5fed8b-b89a-433a-a491-17ea24143056/ihyt_a_1792562_f0006_c.jpg)
Figure 7. Exposure time required to increase the tissue temperature by 6 K (ET6K) in the upper thigh of piglets as a function of tissue depth during wIRA-irradiation using an irradiance of 126.5 mW cm−2 (IR-A). Data: mean values and standard deviations. Curve fit using polynominal regression.
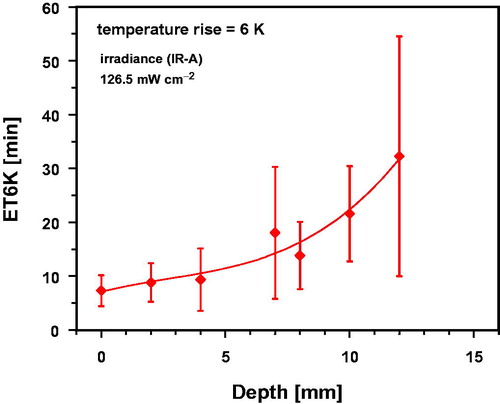
Figure 8. Temperatures T90 (a), T50 (b), T10 (c) and Tmax (d) derived from data of the 10th, 50th, 90th and 100th percentiles of the temperature distributions in the upper thigh of piglets as a function of tissue depth using wIRA with an irradiance of 126.5 mW cm−2. Data were related to a total exposure time of 35 min (curve 1) and to the last 15 min of exposure time upon achieving thermal steady state (curve 2). Broken lines mark the settled thresholds for T90 ≥ 40 °C and T50 ≥ 41 °C [Citation18]. Data: mean values and standard deviations. Dotted lines: upward confidence limit of curve 2 (red) and lower confidence limit of curve 1 (blue), significance level = 5%. Curve fits using polynominal regression.
![Figure 8. Temperatures T90 (a), T50 (b), T10 (c) and Tmax (d) derived from data of the 10th, 50th, 90th and 100th percentiles of the temperature distributions in the upper thigh of piglets as a function of tissue depth using wIRA with an irradiance of 126.5 mW cm−2. Data were related to a total exposure time of 35 min (curve 1) and to the last 15 min of exposure time upon achieving thermal steady state (curve 2). Broken lines mark the settled thresholds for T90 ≥ 40 °C and T50 ≥ 41 °C [Citation18]. Data: mean values and standard deviations. Dotted lines: upward confidence limit of curve 2 (red) and lower confidence limit of curve 1 (blue), significance level = 5%. Curve fits using polynominal regression.](/cms/asset/1a926e50-9d52-43fb-ae1f-de4af2ff5565/ihyt_a_1792562_f0008_c.jpg)
Figure 9. Thermal dose expressed as cumulative equivalent minutes at 43 °C (CEM43) in the thigh of piglets as a function of tissue depth after a total of 35 min of wIRA-exposure with an irradiance of 126.5 mW cm−2. Data: mean values and standard deviations. Broken line: upward confidence limit, significance level = 5%. Curve fit using polynominal regression.
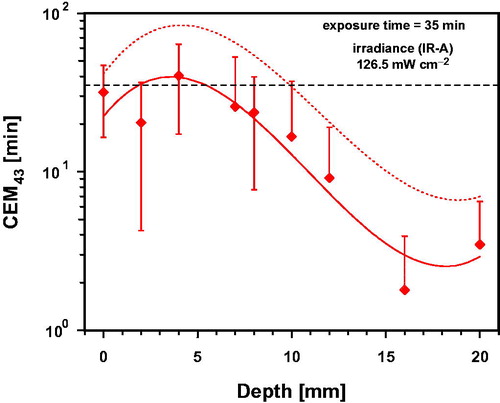
Figure 10. Thermal dose expressed as cumulative equivalent minutes at 43 °C exceeded by 90% of temperature data (CEM43T90) in the upper part of the thigh of piglets as a function of tissue depth during 1 min of wIRA-exposure with 126.5 mW cm−2 and correlated temperature after achieving thermal steady state. Data: mean values and standard deviations. Dotted line: upward confidence limit, significance level = 5%. Curve fit using polynominal regression.
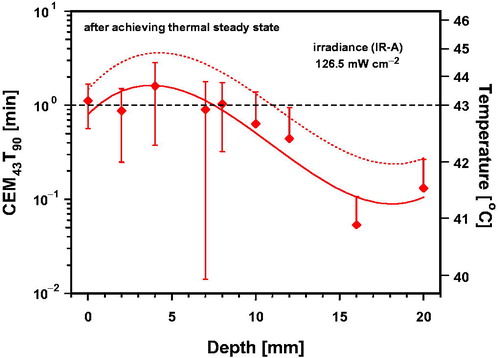
Table 2. Mean in vivo-data measured in superficial tissues of piglets exposed to a wIRA-irradiance of 126.5 mW cm−2 (IR-A) with reference to criteria for adequate tissue heating [Citation1, Citation18].