Figures & data
Figure 1. (A) Example of the setup as used during the DMUA/HIFU procedure with the HIFU probe attached to a 6-degrees of freedom robotic arm. (B) Schematic image indicating the optimal focus from 45–55 mm from the transducer (A and A + D) with a focus range of 10 mm (D). The water bolus is approximately 15 mm (B), which results in an optimal focus range at 30–40 mm from the skin (C and C + D).
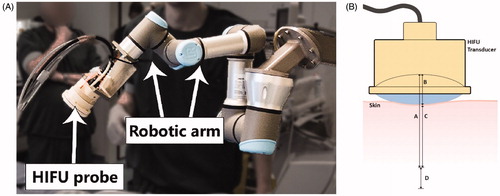
Figure 2. (A) Schematic image of the EFA (red) and vein (blue) and the transversal imaging planes as imaged and treated during the procedure. 6–8 HIFU shots were delivered in between the artery and the vein (black asterisks) which form a continuous lesion (orange semicircle). The lower part of the scheme represents the simplified cutting process, differentiating between the target area and the sliced area. Area A contains the target area of 2.5–3.5 cm, while area B is outside the treatment range, which explains that we identified slides without histological changes. (B) (Diagnostic) ultrasound image of the transversal plane of the EFA (A) and femoral vein (V). The image view is the same as during the procedure while using the HIFU/DMUA imaging.
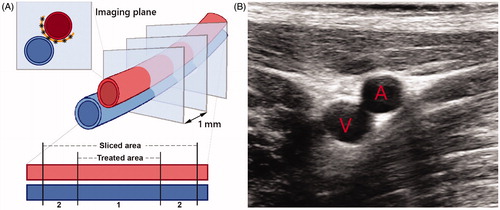
Table 1. Characteristics of the difference protocols (1, 2 and 3) as used in this study.
Figure 3. Example of diagnostic ultrasound image, as used for the calculation of the mean diameter of the target vessel. Two separate ultrasound images were fused (1 and 2), after which the diameter was determined (between the green and yellow lines).
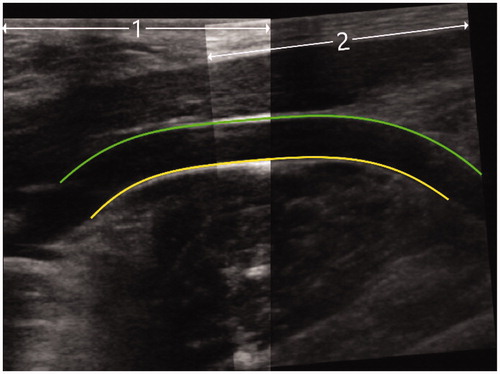
Table 2. Mean diameters in mm of the EFA pretreatment (pre), post-treatment (post) and after the follow-up period (after FUP), per control-/treatment side per animal, categorized per protocol and follow-up period in days.
Figure 4. Three-way interacting effects between HIFU/DMUA-protocols, follow-up time and side on change in mean arterial diameter (in mm) of the treated EFA.
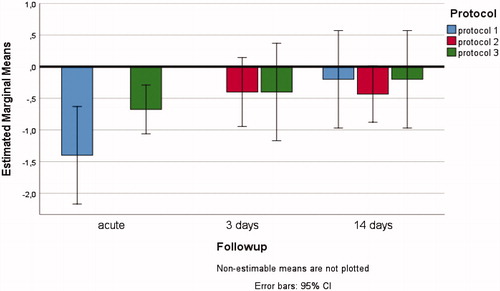
Table 3. Characteristics of the ultrasound images that were scored as mild stenosis (30–50%) directly post HIFU therapy.
Figure 5. Histology after 3 days FUP. At the upper left panel an overview of the EFA, vein and part of the surrounding connective tissue and muscle is shown (H&E). (A) Higher magnification of the intimal layer of the EFA that was completely intact with presence of endothelial cells (A1. H&E and A2. ERG immunostain) (B) Higher magnification of the medial and adventitial layer of the EFA and the connective tissue in between the artery and vein that revealed fibrinoid, reactive, changes with activated fibroblasts and macrophages (B1. H&E and B2. Elastic van Gieson stain). (C) Higher magnification of the striated muscle with an inflammatory infiltrate with macrophages around some necrotic striated muscle cells (C1. H&E and C2. Elastic van Gieson stain).
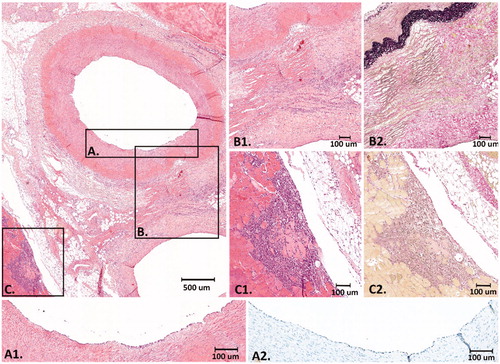
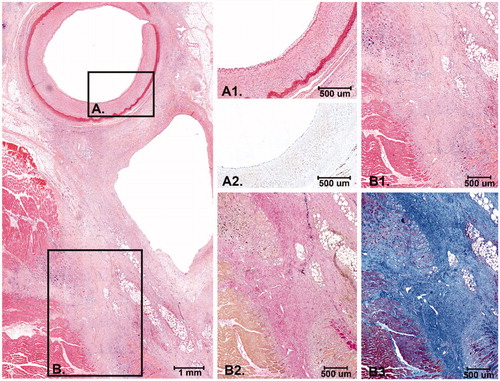
Figure 6. Histology after 14 days FUP. At the left panel an overview of the EFA, vein and the surrounding connective tissue and striated muscle is shown. The connective tissue between the artery and the vein is (partly) replaced by scar tissue with activated fibroblasts and collagen deposition. (A) Higher magnification of the intimal layer of the EFA with presence of endothelial cells and the medial layer that was largely unaffected (A1. H&E and A2: ERG immunostain). (B) The scar tissue extends into the surrounding striated muscle tissue with macrophages and remnant atrophic muscle cells (B1: H&E, B2: Elastic van Gieson stain and B3: Masson’s Trichrome stain).