Figures & data
Figure 1. This heatmap demonstrates genetic pathway scores for the various treatment groups. This graph depicts the information for many pathways, but highlighted here are important immune and cytotoxic signaling pathways. There are clear differences in pathway scores (determined by cumulative expression for all genes in the pathway) in treatments involving radiation, with 15 Gy mNPH having more changes as compared to 3x8 Gy mNPH. The heatmap colors represent different pathway scores ranging from lower (blue) to higher (yellow).
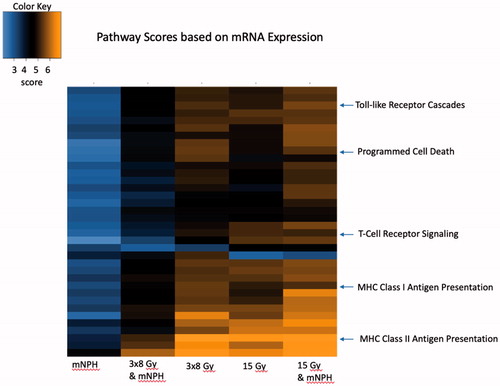
Table 1. This table demonstrates the relative change (linear fold change in differential expression) for all treatment cohorts as compared to control for genes that are significantly affected by mNPH and/or radiation and discussed in the text.
Figure 2. This box and whisker graph illustrates the CD8 population percentages for each treatment. The combinatorial treatments have a greater spread than the radiation alone groups, and 15 Gy alone and in combination leads to greater CD8 populations within the tumor. The red x demonstrates the mean, and the * means p <.05.
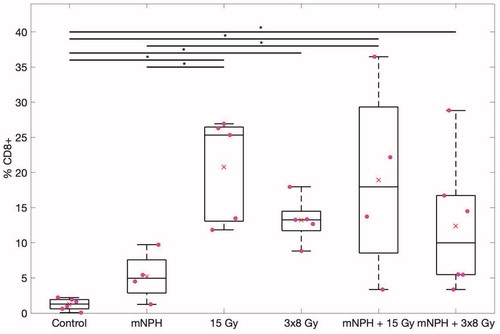
Figure 3. This graph demonstrates post-treatment tumor response, for the following groups: control, mNPH, 15 Gy, 3x8Gy, 15 Gy + mNPH, and 3x8 Gy + mNPH. All treatments resulted in statistically significant improvements as compared to control. The mNPH treatment, which is generally considered minimally cytotoxic was expectedly less effective than either radiation dose or the combination.
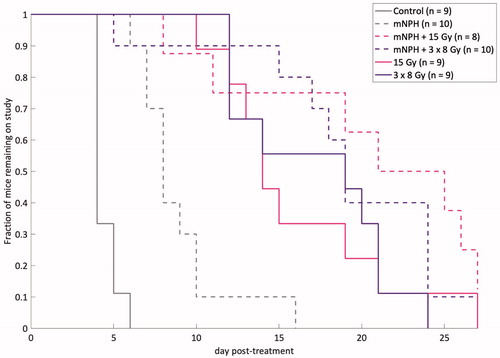
Figure 4. This graph demonstrates the tumor growth curves for all animals in each treatment cohort, with tumor volume on a log scale. The average growth rate is reported for each treatment. Each treatment led to a decreased rate of growth as compared to control.
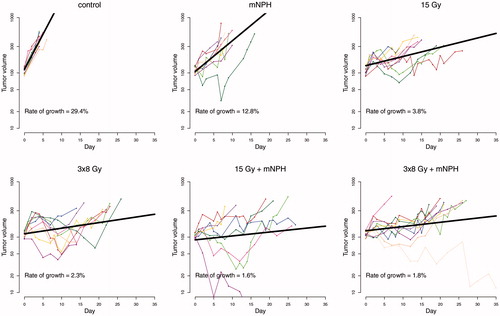
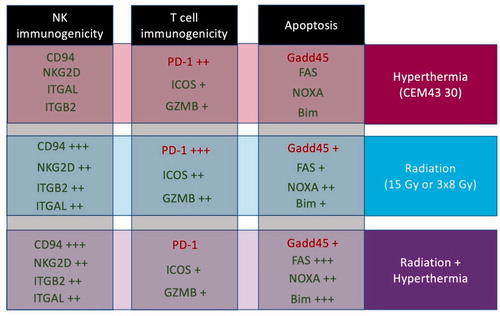
Figure 5. This diagram demonstrates the specific gene expression changes identified in this study. The genes are separated by effect/pathway and treatment type, with green indicating pro-immunogenic or pro-apoptotic genes, and red indicating genes that are anti-immunogenic or anti-apoptotic. The plus signs (+) corresponds to the level of increased gene expression, as compared to control. It is important to note that the combination of hypofractionated radiation therapy with magnetic nanoparticle hyperthermia led to greater changes in both Natural Killer cell and T cell activation/cytotoxicity, as well as apoptosis.