
Figures & data
Figure 1. Time sequence for drug delivery in rabbits with Vx2 tumors using LTLD and MR-HIFU mild hyperthermia. Three different doses of LTLD (0.1, 0.5, and 2.5 mg/kg) were administered in the first 5 min. Temperature mapping was continued for 10 min after treatment to observe tissue cooling (during which period the temperature of the heated region returned to baseline). The heated tumors, contralateral unheated tumor, and other organs were harvested 3 h after the start of LTLD infusion for drug quantification using silver nitrate/chloroform extraction with LC-MS/MS readout.
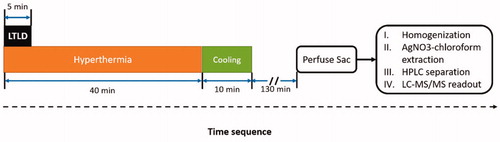
Figure 2. Treatment planning and temperature measurements during a 40 min mild hyperthermia treatment. Treatment planning was performed based on T2-weighted MR images indicating the tumor location (A,B). (C) Temperature maps across and along the ultrasound beam show the heating pattern in the middle of the treatment. The treated ROI is indicated by the white circle and the black contour indicates the 42 °C isotherm. The mean temperature, T10, and T90 within the ROI are shown in D confirming stable temperature control at 42 °C during the treatment. The beginning and end of the treatment area marked with the green vertical lines. Scale bar = 2 cm.
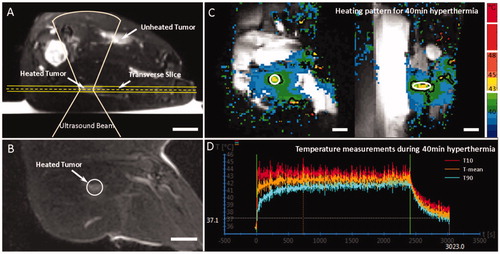
Table 1. Characteristics and heating quality in rabbits administered with LTLD at different doses: 0.1, 0.5 and 2.5 mg/kg, with 40 min MR-HIFU hyperthermia treatment.
Figure 3. DOX accumulated concentration in rabbits treated with different injected doses of LTLD and MR-HIFU hyperthermia. Significantly higher DOX concentration was observed in tumors and other organs with increased injected LTLD. DOX concentration for muscle at 0.1 mg/kg was below the LOQ. *p ≤ 0.05, **p ≤ 0.01, ***p ≤ 0.001, ****p ≤ 0.0001.
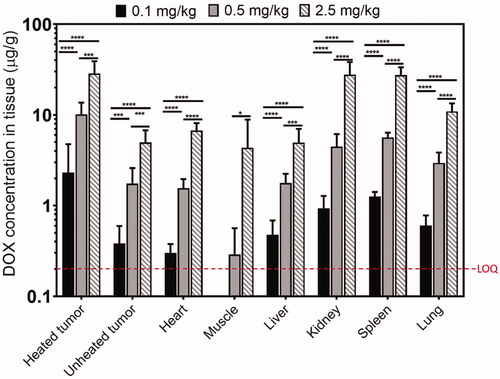
Figure 4. DOX uptake efficiency, defined as tissue doxorubicin accumulation divided by administered dose, for the three administered doses of LTLD investigated in this study. For organs with constant efficiency across all doses, accumulated DOX is proportional to injected dose. Diminishing returns at higher doses for some tissues might be related to saturation of cellular uptake. Only liver showed a significant difference in the uptake efficiency with increasing dose. Muscle showed an increase in efficiency; however the absolute DOX levels were close to the LOQ at low doses, so this might not be an accurate trend. *p ≤ 0.05. The data labeled with ¤ was from a previous study using a similar Vx2 tumor model that was treated with LTLD (5 mg/kg) plus MR-HIFU hyperthermia (30 min in three heating and cooling cycles) [Citation11].
![Figure 4. DOX uptake efficiency, defined as tissue doxorubicin accumulation divided by administered dose, for the three administered doses of LTLD investigated in this study. For organs with constant efficiency across all doses, accumulated DOX is proportional to injected dose. Diminishing returns at higher doses for some tissues might be related to saturation of cellular uptake. Only liver showed a significant difference in the uptake efficiency with increasing dose. Muscle showed an increase in efficiency; however the absolute DOX levels were close to the LOQ at low doses, so this might not be an accurate trend. *p ≤ 0.05. The data labeled with ¤ was from a previous study using a similar Vx2 tumor model that was treated with LTLD (5 mg/kg) plus MR-HIFU hyperthermia (30 min in three heating and cooling cycles) [Citation11].](/cms/asset/45d9bd2c-be03-41e9-bbca-3b6727d7202e/ihyt_a_1812737_f0004_c.jpg)
Figure 5. Tumor DOX delivery enhancement with MR-HIFU hyperthermia defined as the ratio of doxorubicin accumulation in heated tumor and unheated tumor for different administered doses of LTLD. A ratio larger than 1 indicating an enhanced drug delivery effect using LTLD combined with mild hyperthermia. There were no significant differences in DOX delivery enhancement among three dose groups, although there was a trend that the enhancement is increasing with lower administered doses.
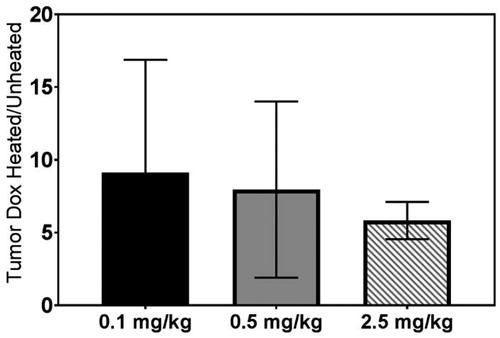
Figure 6. THDCR of DOX accumulation in the tumors and the heart in rabbits treated with different doses of LTLD and MR-HIFU hyperthermia. A nearly 6-fold increase in THDCR index was observed in heated tumors compared to unheated tumors for all groups. The data labeled with ¤ was from a previous study using a similar Vx2 tumor model that was treated with LTLD (5 mg/kg) plus MR-HIFU hyperthermia (30 min in three heating and cooling cycles) [Citation11].
![Figure 6. THDCR of DOX accumulation in the tumors and the heart in rabbits treated with different doses of LTLD and MR-HIFU hyperthermia. A nearly 6-fold increase in THDCR index was observed in heated tumors compared to unheated tumors for all groups. The data labeled with ¤ was from a previous study using a similar Vx2 tumor model that was treated with LTLD (5 mg/kg) plus MR-HIFU hyperthermia (30 min in three heating and cooling cycles) [Citation11].](/cms/asset/a1fe4a3f-7e8a-4885-9abc-1784fbb6b87c/ihyt_a_1812737_f0006_c.jpg)