Figures & data
Figure 1. (a) Moderate hyperthermic heating occurs in periablational zone and has been related with tumor cell activity [Citation1]. This heating could affect either a tumor area outside the thermal coagulation zone (which is completely destroyed) or nearby micronodules. (b) Relation between percentage of living cells after heating and index Ω obtained from the Arrhenius damage model, which associates temperature with exposure time using a first-order kinetics relationship. Periablational zone was assumed to be between Ω = 0.6 and Ω = 2.1 (values derived from experimental data in [Citation1], see text for details), while coagulation zone was defined by the Ω = 4.6 contour, which represents 99% probability of cell death.
![Figure 1. (a) Moderate hyperthermic heating occurs in periablational zone and has been related with tumor cell activity [Citation1]. This heating could affect either a tumor area outside the thermal coagulation zone (which is completely destroyed) or nearby micronodules. (b) Relation between percentage of living cells after heating and index Ω obtained from the Arrhenius damage model, which associates temperature with exposure time using a first-order kinetics relationship. Periablational zone was assumed to be between Ω = 0.6 and Ω = 2.1 (values derived from experimental data in [Citation1], see text for details), while coagulation zone was defined by the Ω = 4.6 contour, which represents 99% probability of cell death.](/cms/asset/4a647526-10ec-486b-a25a-c51666310efc/ihyt_a_1823022_f0001_c.jpg)
Table 1. Characteristics of materials used in the computer model [Citation14,Citation15,Citation18–20].
Figure 2. Temperature distributions computed from RFA(Cool-tip applicator, pulsed protocol, 10 min) and MWA (Amica-Gen applicator, 60 W continuous application, 10 min) just after switch-off (a) and 10 min later (b). White lines represent limits of coagulation zone (Ω > 4.6) and periablational zones (0.6 < Ω < 2.1). (Scale in °C; MWA temperatures exceeded 110 °C).
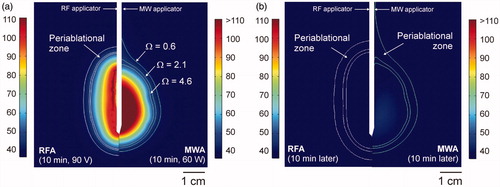
Figure 3. Coagulation and periablational zone volumes in RFA/MWA simulations. Lighter color bars and bottom values are the volumes computed just after switch-off. Darker color bars represent the increase in volume 10 min after switch-off. Upper values give total volumes after this 10-min period.
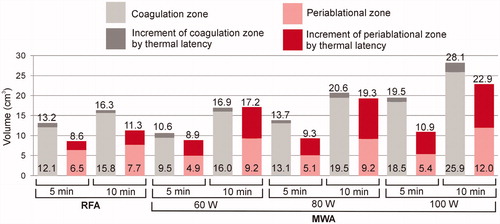
Figure 4. Periablational/coagulation volume ratios in RFA/MWA simulations. Lighter color bars and bottom values are the ratios computed just after switch-off. Darker color bars represent the increased ratio 10 min after switch-off. Upper values show the ratio after this 10-min period.
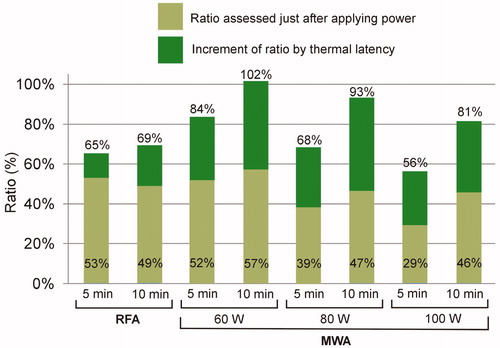
Table 2. Comparison of RFA/MWA coagulation transverse diameters (in cm) computed by FEM (Finite Element Method) and reported in clinical and experimental studies (in vivo ablations only) [Citation27–38].
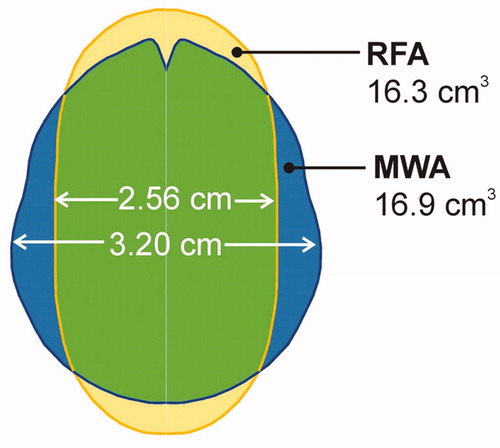
Figure 5. Overlapping coagulation zones after 10 min of RFA (∼51 W) and MWA (60 W). Note that while the volumes offer similar values, the MWA transverse diameter is larger.