Figures & data
Figure 1. Schematic of transducer geometry.
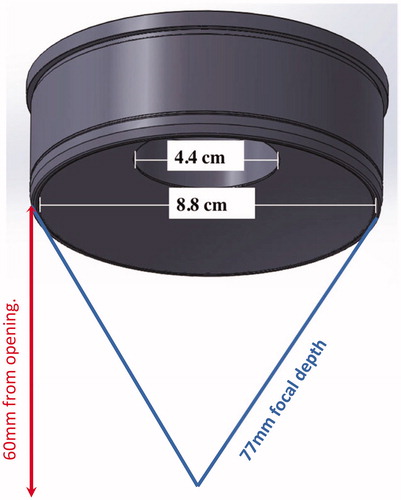
Figure 2. (A–B) Alignment of the aluminum cradle to the target using optical and radiological markers placed at the center of the fluoroscopy intensifier and on the patient skin. (C–D) Anatomical targeting as seen on the X-ray image.
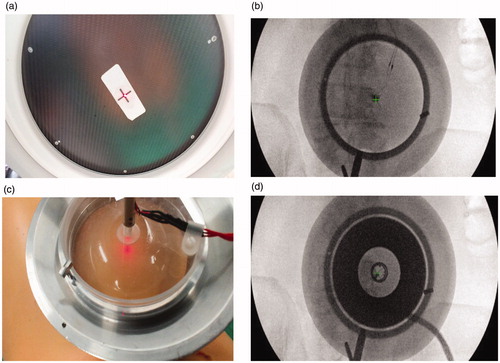
Figure 3. CT images were loaded into MATLAB to generate the bone geometry for simulation.
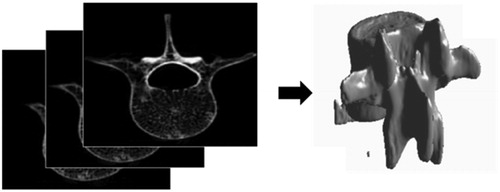
Figure 4. Schematic of all components for simulating FUS treatment.
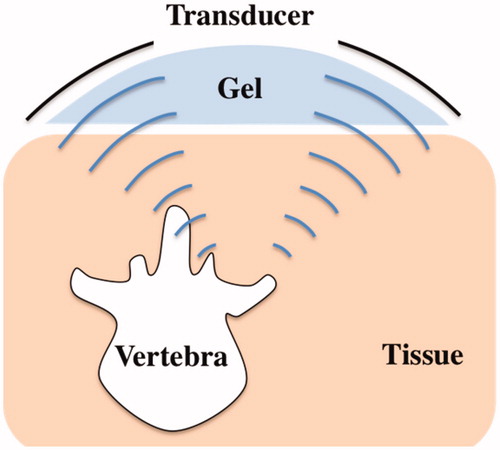
Table 1. Thermal and acoustical properties of tissues.
Figure 5. Slice of the 3 D anatomy used in simulations.
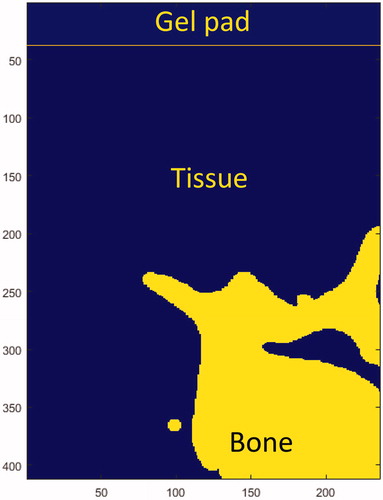
Figure 6. (A) Profile through the focal spot of the pressure field for incoherent and coherent mode. Slice through the center of the focal spot of the pressure field for (B) incoherent and (C) coherent mode for water. Color bar represents pressure gain (ratio of the pressure at the acoustic focus to the pressure at the transducer’s surface).
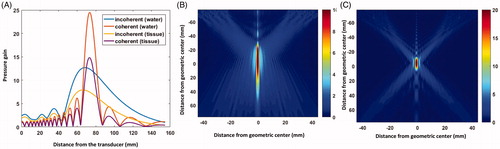
Figure 7. Slice of the 3 D anatomy used in simulations. (A) Outline of bone with respect to the RMS pressure. Thermal rise for a 50 s sonication at 30 W : 2 D map (B) and time curves (C) of the temperature at the surface of the bone (black), 0.75 mm (blue) and 1.125 mm (red) away in tissue.
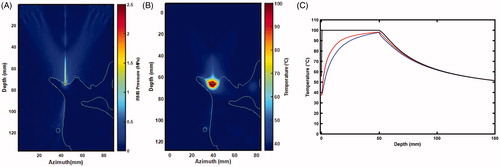
Figure 8. Gross pathology of one of the lesions.
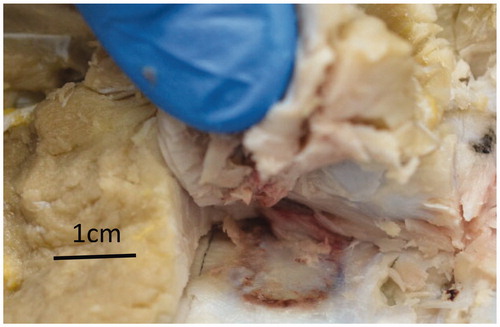
Figure 9. Two 3 D views of the pig bone and simulated lesion showing that the lesion is at the facet joint.
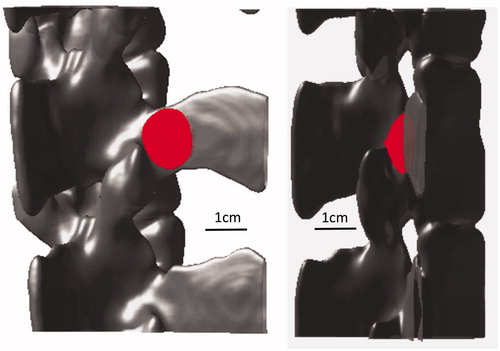
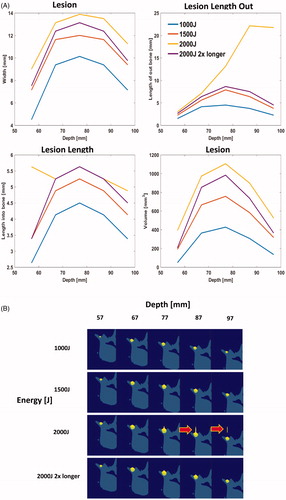
Figure 10. (A) Characterization of lesion dimensions as a function of bone absorption. The red line corresponds to lesion outside of the bone, yellow line corresponds to lesion in the bone, and blue line represents the width of the lesion. (B) 2 D slice through the bone and lesion, simulated with an absorption of 30 dB/cm, bone depth of 80 mm, with 2000 J energy delivered over 50 s.
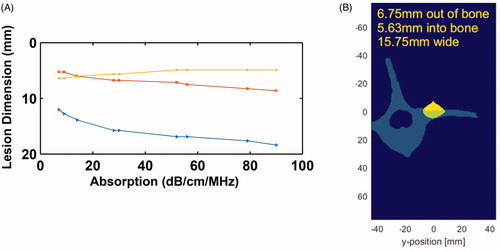
Figure 11. (A) Lesion dimensions as a as a function of depth for various energy levels. (B) Images of lesions and bone for the scenarios tested. Arrows point out conditions with secondary lesions. Because of secondary lesions we tested 2× longer sonication duration (on next page).