
Figures & data
Figure 1. The flow chart for patient enrollment. RFA: radiofrequency ablation; HCC: hepatocellular carcinoma; MLC: metastatic liver cancer; Tx: treatment. Drop off: (a) The electrodes were moved during the RFA treatment. (b) The patients missed follow up of CT/MRI in one month.
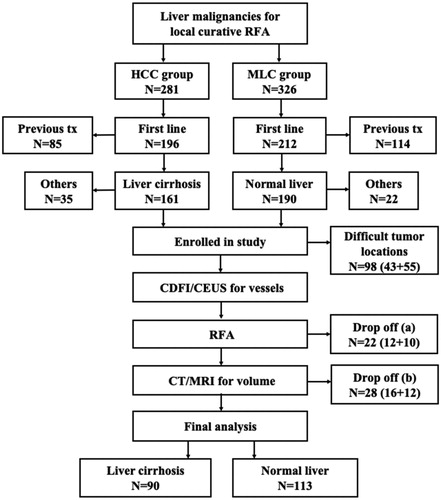
Table 1. Comparison of baseline profiles of patients with liver malignancies between liver cirrhosis and normal liver groups.
Figure 2. A 54-year-old male had hepatocellular carcinoma with liver cirrhosis. α-AFP was 1848 ng/ml, CEA was 0.97 ng/ml, and CA-199 was 15.02 U/ml. (a) Contrast-enhanced ultrasound (CEUS) before radiofrequency ablation (RFA) showed the tumor size was 2.4 × 1.8 cm. (b) RFA was performed under ultrasound guidance with three 3 cm tip RF electrodes and the distance of electrodes was 1.3 cm. One month follow up contrast enhanced computed tomography on axial section (c) and sagittal section (d) showed the ablation zone (△) had no enhancement and the ablation zone was approximately sphere. The length, width and thickness of ablation zone was 4.0 cm, 3.5 cm, 3.2 cm, respectively.
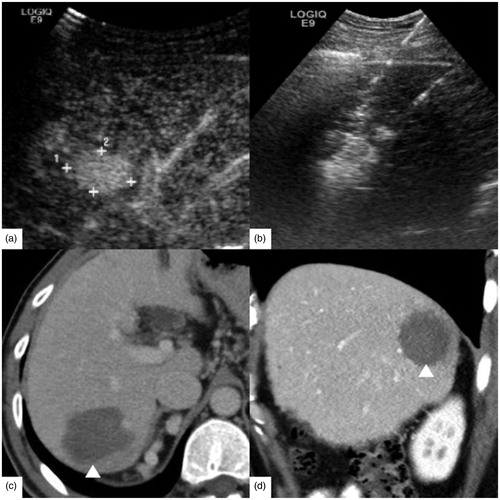
Figure 3. A 63-year-old female had rectal carcinoma with liver metastasis. CEA was 5.27 ng/ml, CA-199 was 143.8 U/ml and α-AFP was 2.10 ng/ml. (a) Contrast-enhanced ultrasound (CEUS) before RFA showed the tumor size was 2.4 × 1.6 cm. (b) RFA was performed with three 3 cm tip RF electrodes and the distance of electrodes was 1.3 cm. Contrast enhanced computed tomography in one month on axial section (c) and sagittal section (d) showed the ablation zone (△) had no enhancement and the ablation zone was approximately ellipsoid. The length, width and thickness of ablation zone was 2.8 cm, 2.0 cm, 1.9 cm, respectively.
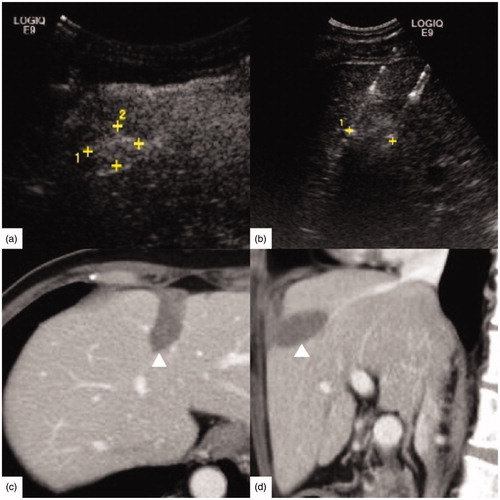
Table 2. Comparison of ablation zone with 3 cm and 4 cm tip RF electrodes between liver cirrhosis and normal liver groups.
Figure 4. A 65-year-old male had hepatocellular carcinoma with liver cirrhosis. CEA was 1.61 ng/ml, α-AFP was 2.14 ng/ml and CA-199 was 10.20 U/ml. (a) Enhanced magnetic resonance imaging (MRI) before radiofrequency ablation (RFA) showed the tumor size was 2.6 × 2.3 cm (↑). (b) RFA was performed under ultrasound guidance with three 4 cm tip RF electrodes and the distance of electrodes was 1.6 cm. One month follow up contrast enhanced computed tomography on axial section (c) and coronary section (d) showed the ablation zone (△) had no enhancement. The length, width and thickness of ablation zone was 5.5 cm, 4.0 cm, 3.7 cm, respectively.
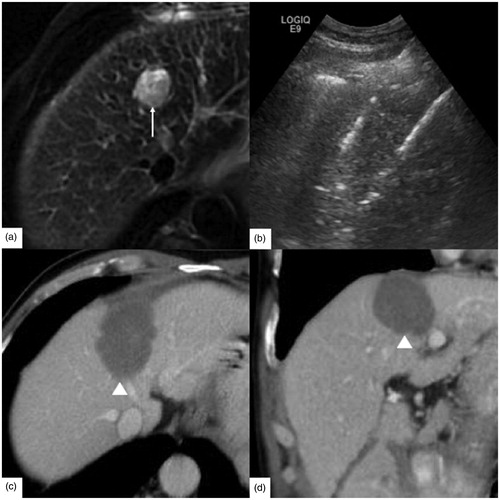
Figure 5. A 39-year-old male had rectal carcinoma with liver metastasis. CEA was 30.06 ng/ml, α-AFP was 10.36 ng/ml, CA-125 was 14.70 U/ml and CA-199 was 23.01 U/ml. (a) The tumor was hypodense at the portal venous phase of contrast enhanced computed tomography before radiofrequency ablation (RFA). And the tumor size was 2.5 × 2.0 cm (↑). (b) RFA was initiated under ultrasound guidance with three 4 cm tip RF electrodes and the distance of electrodes was 1.5 cm. One month follow up enhanced magnetic resonance imaging (MRI) on axial section (c) and coronary section (d) showed the ablation zone (△) had no enhancement and the length, width and thickness of ablation zone was 4.2 cm, 2.8 cm, 2.5 cm, respectively.
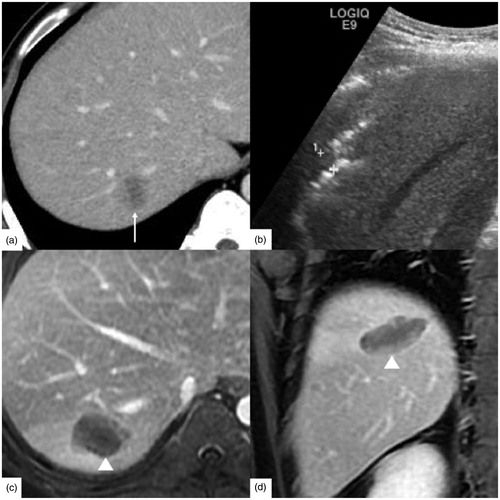
Table 3. Comparison of the maximum flow velocity and arrival time of hepatic vessels between liver cirrhosis and normal liver background with color Doppler flow imaging and contrast-enhanced ultrasound.
Figure 6. The simple linear regression analysis between ablation zone of two 3 cm electrodes and the arrival time (AT) of hepatic vein. The width (a), thickness (b) and volume (c) were statistically associated with the AT of hepatic vein (Adjusted R2 = 0.271, adjusted R2 = 0.289, adjusted R2 = 0.294; p < 0.001, p < 0.001, p < 0.001).
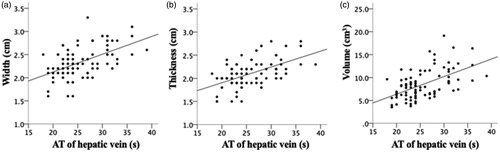
Table 4. Multiple linear regression analysis between ablation zone and the hepatic flow parameters.