Figures & data
Figure 1. The device used for local RF-induced hyperthermia treatment and heating methods for in vitro and in vivo experiments. (A) In vitro experimental setup. (B) In vivo experimental setup. The tumor on one side of the leg was heated at 42.5 °C for 20 min under anesthesia. The temperature on the tumor surface was monitored during heating.
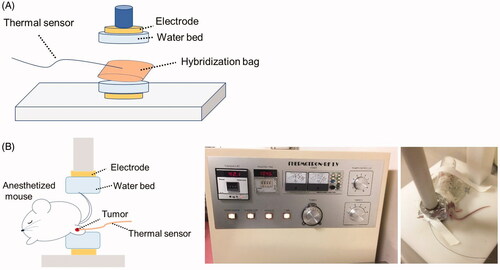
Figure 2. In vivo experimental scheme. (A) Scheme of tumor volume analysis. BALB/c mice were divided into the NoTx (N = 16), HT (N = 19), C4 (N = 17) and HT + C4 (N = 18) groups. Treatments were initiated on day 1, when the average of the longest length and the perpendicular length in tumors reached 5 mm. (B) Experimental scheme for the analysis of lung metastasis. Lungs were harvested from mice in the C4 (N = 7) and HT + C4 (N = 9) groups on day 13. (C) Experimental scheme of FTY720 treatment. FTY720 was injected via i.p. on day 0 and repeated thereafter every 2 days until day 18. Tumor volumes and survival rates were compared between the HT + C4 + FTY720 (N = 12) and HT + C4 groups (N = 24). Abbreviations. InOc: Inoculation; HT: Hyperthermia; C4: CTLA-4 blockade; FTY: Fingolimod.
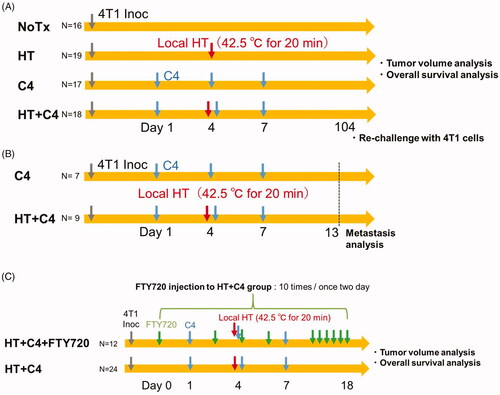
Figure 3. Temperature-dependent 4T1 cell survival at 37 °C (N = 3), 41 °C (N = 3), 42.5 °C (N = 3), and 43.5 °C (N = 3) via the colony formation assay. Error bars represent SD. **p < 0.01. (vs 37 °C); ††p < 0.01.
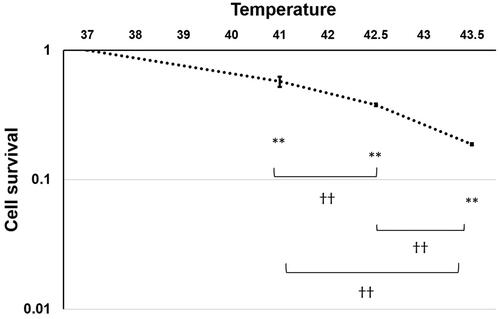
Figure 4. Effect of local HT on the antitumor response in locally heated (HT) tumors. (A) Tumor growth curves for the HT tumors (NoTx: N = 16, HT: N = 19, C4: N = 17, and HT + C4: N = 18). (B) Quantitative analysis of tumor volume change on day 28. (C) Number of mice who responded in the C4 and HT + C4 groups. A responder is defined as a mouse with a smaller tumor volume on day 28 than on day 1. Data are combined from two independent experiments. Error bars represent SEM. *p < 0.05.; **p < 0.01. Abbreviations. Inoc: Inoculation; HT: Hyperthermia; C4: CTLA-4 blockade.
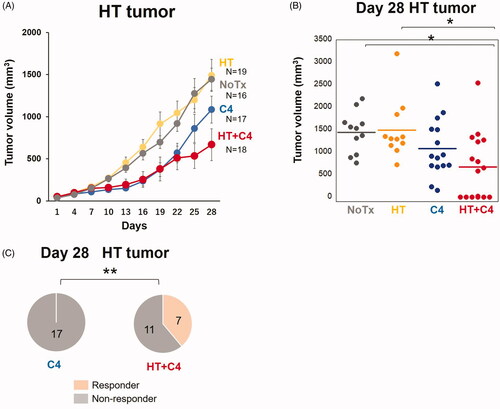
Figure 5. Effect of local HT on the abscopal effect. (A) Tumor growth curves for UnHT tumors (NoTx: N = 16, HT: N = 19, C4: N = 17, HT + C4: N = 18). (B) Distribution of the tumor volume in the mice of each group on day 28. (C) Number of responders in the C4 and HT + C4 groups. A responder is defined as a mouse with a smaller tumor volume on day 28 than on day 1. Data are combined between two independent experiments. Error bars represent SEM. *p < 0.05, **p < 0.01. Abbreviations. HT: Hyperthermia; C4: CTLA-4 blockade.
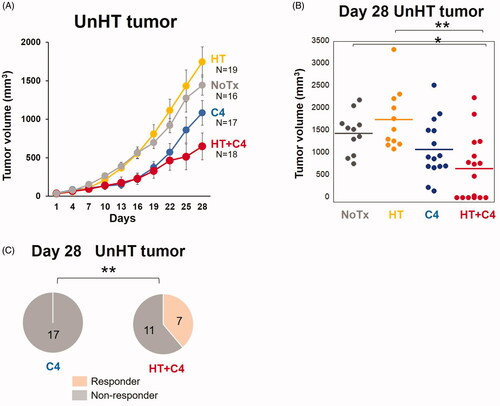
Figure 6. Local HT with C4 inhibits lung metastasis and prolongs overall survival. (A) Representative graphs of the metastases in the C4 and HT + C4 groups. (B) The number of metastases in the lungs in the C4 (N = 7) and HT + C4 (N = 9) groups at day 13. (C) Overall survival of the mice in the C4 group (N = 17) and the HT + C4 group (N = 18). Data are combined between two independent experiments. (D) Experimental scheme for the analysis of rechallenge with 4T1 cell inoculations. (E) Overall survival after rechallenge with 4T1 cell inoculations in the five cured mice in the HT + C4 group. Error bars represent SEM. *p < 0.05. HT: Hyperthermia; C4: CTLA-4 blockade.
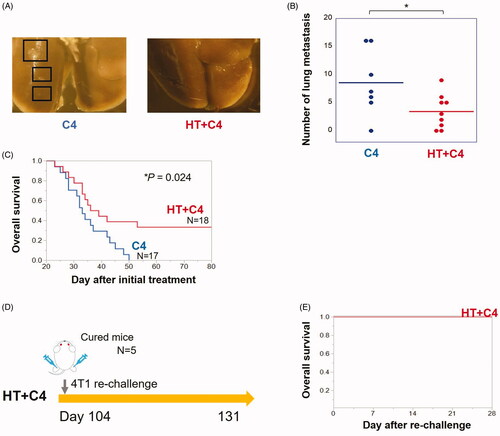
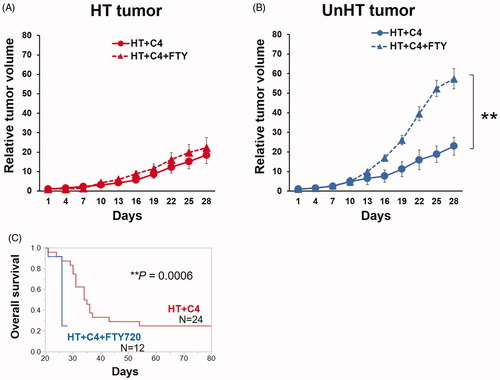
Figure 7. Tumor growth and overall survival in the HT + C4 + FTY720 (N = 12) and HT + C4 (N = 24) groups. (A) Tumor growth curves in HT tumors. (B) Tumor growth curves in UnHT tumors. (C) Overall survival. Data are combined from two independent experiments. Error bars represent SEM. **p < 0.01. Abbreviations. HT: Hyperthermia; C4: CTLA-4 blockade; FTY720: Fingolimod.