
Figures & data
Figure 1. Schematic representation of the radiotherapy and hyperthermia schedules in unifocal and multifocal muscle invasive bladder cancers (Reproduced with permission from Datta et al. [Citation17]).
![Figure 1. Schematic representation of the radiotherapy and hyperthermia schedules in unifocal and multifocal muscle invasive bladder cancers (Reproduced with permission from Datta et al. [Citation17]).](/cms/asset/dc9e4413-3c6b-4b18-a85e-7b463cea143a/ihyt_a_1875060_f0001_c.jpg)
Figure 2. A representative time–temperature plot from a patient of urinary bladder cancer undergoing hyperthermia. Temperature represents the intraluminal temperature in bladder at every 10 s during the entire 90 min of deep hyperthermia. The area under the curve (AUC) for >37 °C (AUC > 37 °C) and ≥39 °C (AUC ≥ 39 °C) represents the corresponding areas enclosed within these temperatures.
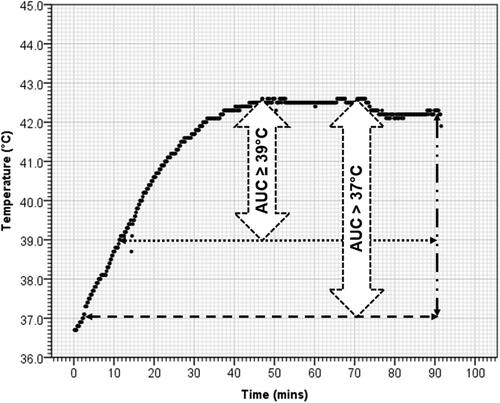
Table 1. Patient demography: all evaluable patients, patients with or without local failure in bladder at follow-up.
Table 2. Details of the thermal dose parameters for summated hyperthermia sessions – AUC >37 °C, AUC≥ 39 °C, CEM 43, CEM43 (>37 °C), CEM 43(≥ 39 °C), Tmean, Tmax, Tmin, duration of hyperthermia session, radiotherapy dose and the local disease status for each patient.
Table 3. Hyperthermia treatment characteristics both for individual and combined hyperthermia sessions of all patients and those with or without local failure in bladder at follow-up.
Figure 3. Time–temperature plots for each of the four hyperthermia sessions in a patient who had (a–d) local bladder tumor control and (e–h) who had local bladder tumor failure. Corresponding CEM43 (≥39 °C) and AUC ≥ 39 °C for each of these sessions are stated. The graphs correspond to patient number 15 (a–d) who had no local failure and patient nos. 14 (e–h) who had local failure. The details of the CEM and AUC values for these patients are given in Supplementary Table 1.
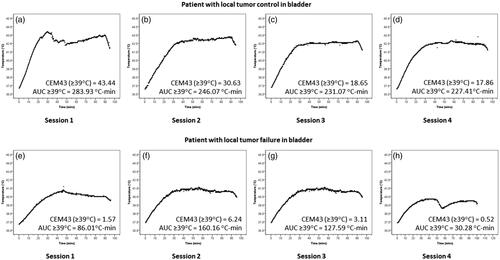
Figure 4. Box plots and superimposed scatter plots of AUC > 37 °C, AUC ≥ 39 °C, CEM43(>37 °C) and CEM43(≥39 °C) in patients with or without local failure in bladder (a) Individual hyperthermia sessions (n = 74) [AUC > 37 °C, p = 0.018; AUC ≥ 39 °C, p = 0.01; CEM43(>37 °C), p < 0.001 and CEM43(≥39 °C), p < 0.001)] and (b) Summated hyperthermia sessions (n = 18) [AUC > 37 °C, p < 0.001; AUC ≥ 39 °C, p < 0.001; CEM43(>37 °C), p < 0.001 and CEM43(≥39 °C), p < 0.001].
![Figure 4. Box plots and superimposed scatter plots of AUC > 37 °C, AUC ≥ 39 °C, CEM43(>37 °C) and CEM43(≥39 °C) in patients with or without local failure in bladder (a) Individual hyperthermia sessions (n = 74) [AUC > 37 °C, p = 0.018; AUC ≥ 39 °C, p = 0.01; CEM43(>37 °C), p < 0.001 and CEM43(≥39 °C), p < 0.001)] and (b) Summated hyperthermia sessions (n = 18) [AUC > 37 °C, p < 0.001; AUC ≥ 39 °C, p < 0.001; CEM43(>37 °C), p < 0.001 and CEM43(≥39 °C), p < 0.001].](/cms/asset/8fe47b99-ec4b-45c5-b15f-5e507363dcd7/ihyt_a_1875060_f0004_c.jpg)
Figure 5. (a) CEM43 (≥39 °C) values for the temperature range 39–45 °C (r2 = 0.999). The slope for changes in CEM43(≥39 °C) values for temperature ranging between 39 °C and 41.5 °C is minimal. The slope changes abruptly at 43 °C due to change of the value of constant ‘R’ from 0.25 for T ≤ 43 °C and 0.50 for T > 43 °C (indicated by black filled arrow). (b) AUC ≥ 39 °C values for the temperature range 39–45 °C (r2 = 1.000). For both CEM43(≥39 °C) and AUC ≥ 39 °C, duration of hyperthermia beyond 39 °C is considered for 60 min to mimic the hyperthermia treatment in clinical situation beyond the initial heating phase.
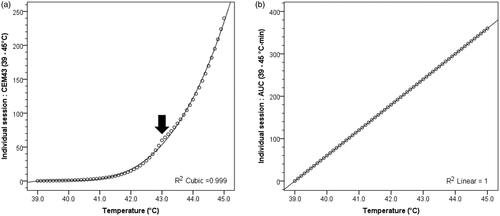
Figure 6. AUC and CEM43 values for patients with or without local bladder failure. (a) CEM43(>37 °C) vs AUC > 37 °C for each hyperthermia session; (b) CEM43(≥39 °C) vs AUC ≥ 39 °C for each hyperthermia session; (c) Summated CEM43(>37 °C) vs AUC > 37 °C for all hyperthermia sessions; (d) summated CEM43(≥39 °C) vs AUC ≥ 39 °C for all hyperthermia sessions.
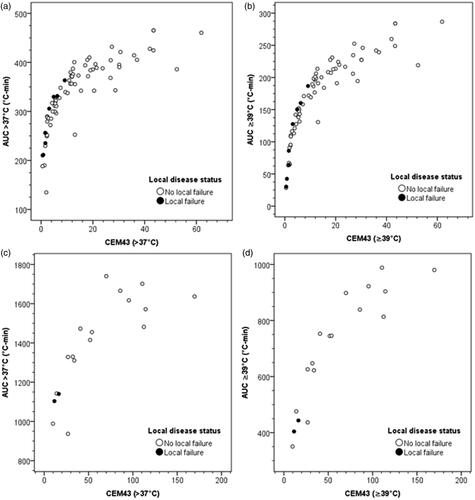
Figure 7. Computation of the additional temperature that is needed to be acquired during the active heating phase of 60 min following attaining 39 °C during the preheating phase. The target AUC ≥ 39 °C to be achieved during each hyperthermia session is 190 °C-min.
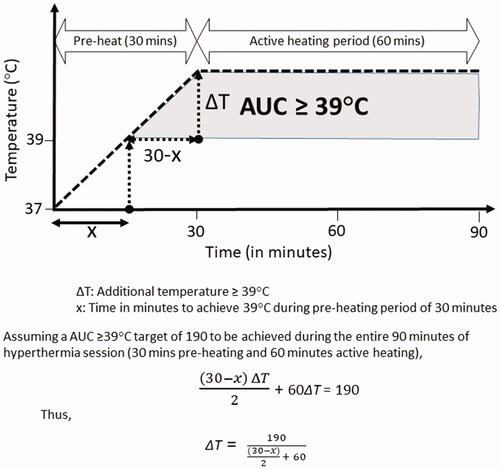
Table 4. Temperature required to be achieved during the active heating phase of 60 min following 30 min of preheating to achieve a target of AUC ≥ 39 °C.
Data availability statement
All data generated and analyzed during this study are included in this published article.