Figures & data
Figure 1 (A) Geometry and dimensions of 14 G MW antenna. (B) Materials making up the antenna. C: Geometry of the computer model and a scheme of the CZ measures: A represents the axial diameter and B the middle of the transverse diameter. Dimensions in mm and schemes out of scale.
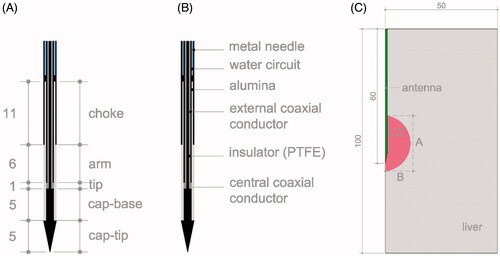
Table 1. Number and characteristics (power and time) of the ex vivo experiments.
Table 2. Characteristics of materials used in the computer model [Citation25,Citation27,Citation46,Citation51].
Figure 2. Relation between the computed (FEM) and experimental (ex vivo) values obtained for the transverse (A) and axial (B) diameters of the coagulation zone for continuous and pulsed MWA. The regression line considered zero crossing.
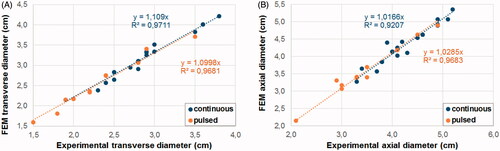
Figure 3. (A and B) Coagulations zones created in an ex vivo model with pulsed MWA at 125 W for 5 min. The dashed lines represent the contours measured on the images: white line for the zone with only white coagulation, and orange for the zone with red hyperemia also. The solid lines represent the Ω = 4.6 isolines (white solid line) and Ω = 1 (orange solid line) computed by the Arrhenius function to represent the CZ boundary. C and D: Comparison of experimental and computational (FEM) results.
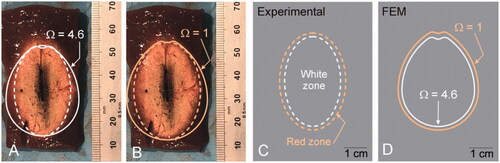
Figure 4. Axial and transverse diameters (A and B) and volumes of the coagulation zones (C and D) computed under ex vivo conditions for different duty cycle values with intensive and low cooling. Duty cycles of 100% are those of the continuous mode while values <100% are in the pulsed mode.
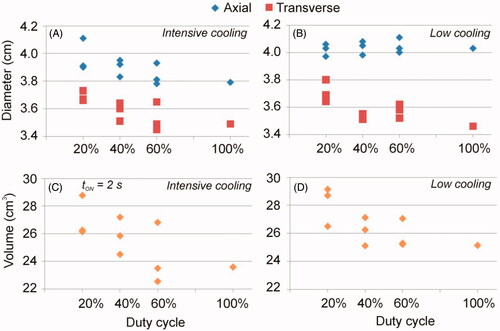
Table 3. Computer result of the simulations mimicking the ex vivo experiments reported by Tosoratti et al [Citation40] (Phase 2).
Table 4. Computer result of the simulations mimicking in vivo conditions (Phase 3).
Table 5. Computer result of the simulations using long pulses.
Figure 5. CZ contour at the end of the application of the first pulse (gray line) and at the end of power application (black line) for 1000 W (A-B) and 46.75 W (C-D) under ex vivo (A-C) and in vivo (B-D) conditions. All cases were with a 60% protocol (6 s on - 4 s off).
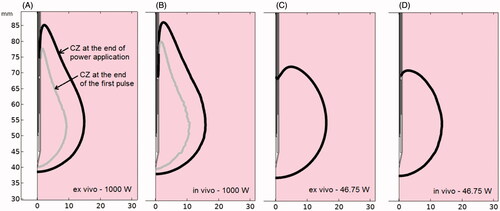
Table 6. Computer result of the simulations using short pulses with very high power utlined in orange.
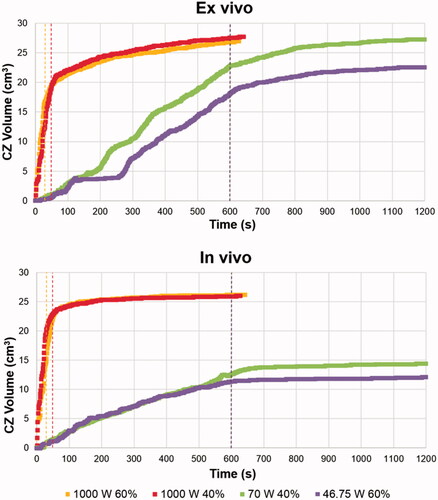
Figure 6. Evolution of CZ volume during the MWA, including the 10 min cooling phase in which CZ can increase due to thermal latency. Dashed colored lines show the end of the power application in the different cases.