Figures & data
Figure 1. Samples under study (a) Ph0: Reference: agarose solution corresponding to healthy tissue phantom, (b) Ph1: agarose with MNPs, corresponding to cancer tissue phantom (c) Ph2: Tumor–healthy tissue interface, (d) Xv0: Reference: Veal tissue sample corresponding to healthy tissue, (e) Xv1: Veal tissue sample with MNPs (Xv1a: 4 mg/mL, Xv1b: 8 mg/mL) corresponding to cancer tissue, (f) Xv2: Tumor (central region)–healthy (peripheral region) tissue interface.
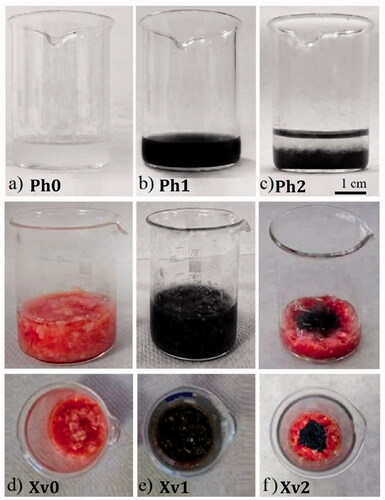
Table 1. Duty cycles and the corresponding field ON/OFF values (in s).
Figure 2. Experimental ΔΤ curves for all operation cycles used in (a) Ph0: reference: healthy tissue and (b) Ph1: cancer tissue, phantoms. The black line represents the continuous mode of AMF ON/OFF: 900/0 (in s) and purple, red, blue and dark cyan curves depict the intermittent mode ON/OFF: 25/50, 50/100, 75/150, 100/200 (in s), respectively. The applied experimental conditions were: AMF amplitude: 60 mT/375 kHz and duty cycle: 33%; the shaded bands illustrate the hyperthermia window (ΔΤ = 4–8 °C).
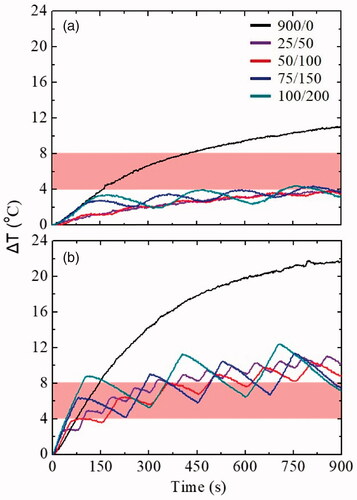
Table 2. Operation cycle experiments in phantoms (Ph0: reference: healthy tissue, Ph1: cancer tissue).
Figure 3. ΔΤ curves of each duty cycle experiment in (a) Ph0: reference: healthy tissue and (b) Ph1: cancer tissue phantoms. The black, red, blue, dark cyan and pink curves depict the intermittent mode ON/OFF: 50/50, 50/100, 50/150, 50/200 and 50/250 (in s), respectively. The applied experimental conditions were: AMF: 60 mT/375 kHz and the hyperthermia window is illustrated with a shaded band.
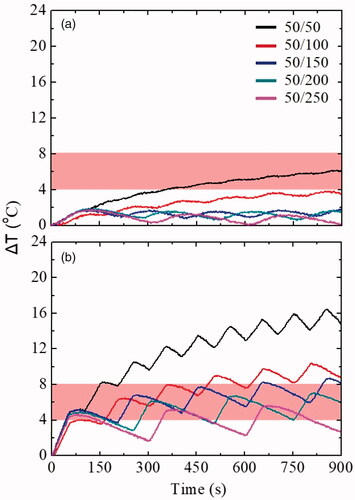
Table 3. Duty cycle experiments in a) Ph0: reference: healthy tissue and b) Ph1: cancer tissue phantoms.
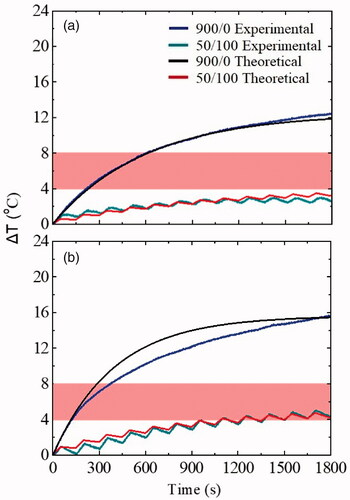
Figure 4. ΔΤ curves of the two optimum magnetic field amplitude values [(a) 45 mT/375 kHz, (b) 60 mT/375 kHz] in Ph0 (reference: healthy tissue) and Ph1 (cancer tissue) phantoms. Dark cyan and red curves represent the intermittent mode ON/OFF: 50/100 (in s) in Ph1 and Ph0, respectively, while blue and black curves illustrate the continuous mode ON/OFF: 900/0 (in s) in Ph1 and Ph0, respectively. Shaded bands denote the hyperthermia window.
![Figure 4. ΔΤ curves of the two optimum magnetic field amplitude values [(a) 45 mT/375 kHz, (b) 60 mT/375 kHz] in Ph0 (reference: healthy tissue) and Ph1 (cancer tissue) phantoms. Dark cyan and red curves represent the intermittent mode ON/OFF: 50/100 (in s) in Ph1 and Ph0, respectively, while blue and black curves illustrate the continuous mode ON/OFF: 900/0 (in s) in Ph1 and Ph0, respectively. Shaded bands denote the hyperthermia window.](/cms/asset/9c61ef08-7b4d-46b4-9cdb-0f710cdac906/ihyt_a_1899310_f0004_c.jpg)
Table 4. Magnetic field experiments in a) Ph0: reference: healthy tissue and b) Ph1: cancer tissue, phantoms.
Figure 5. Theoretical approach of Ph0: reference: healthy tissue phantom (a) 45 mT and (c) 60 mT under continuous and intermittent mode, and Ph1: cancer tissue phantom (b) 45 mT and (d) 60 mT under continuous and intermittent mode. In continuously applied AMF mode theoretical and experimental curves were in good agreement. In the case of intermittent mode, the peaks of theoretical and experimental curves were very close for both Ph0 and Ph1 phantoms. The hyperthermia window is depicted with the shaded bands.
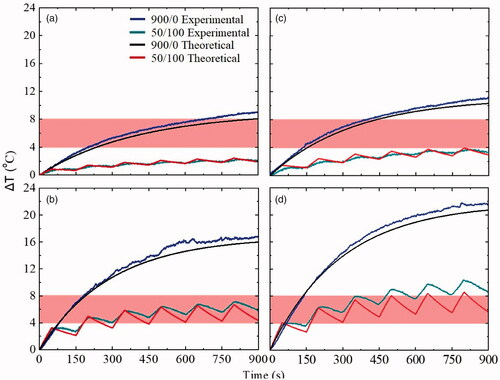
Figure 6. (a) The three measuring points (P.1, P.2, P.3) inside the Ph2 phantom, (b) ΔΤ curves measured at these points (P.1, P.2, P.3) for continuous and intermittent operating modes. Hyperthermia window is denoted with a shaded band.
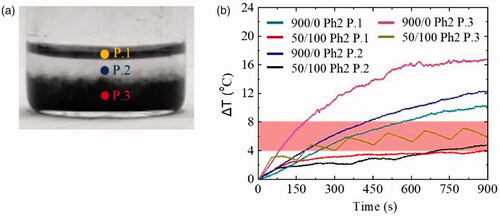
Table 5. Continuous and intermittent mode magnetic fields experiments in Ph2 phantom.
Figure 7. ΔΤ curves of continuous and intermittent operating modes in ex vivo veal tissues without MNPs (Xv0) and with MNPs (a) Xv1: 4 mg/mL MNPs, and (b) Xv1: 8 mg/mL MNPs. The hyperthermia window is illustrated by the shaded bands.
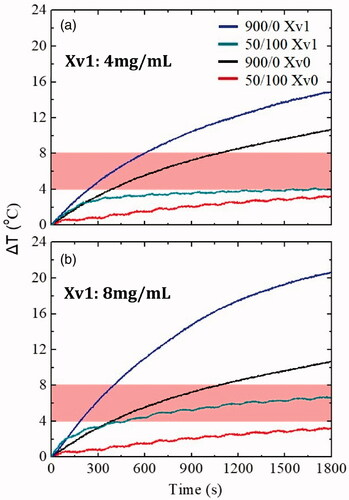
Table 6. Continuous and intermittent mode magnetic fields in ex vivo veal tissues (without MNPs: Xv0, with MNPs: Xv1).
Figure 8. (a) Points (P.1, P.2) where magnetic hyperthermia measurements were performed, (b) ΔΤ curves measured at these points (P.1, P.2) in continuous and intermittent mode of magnetic field application in the ex vivo tumor–healthy tissue interface system Xv2. Hyperthermia window appears as a shaded band.
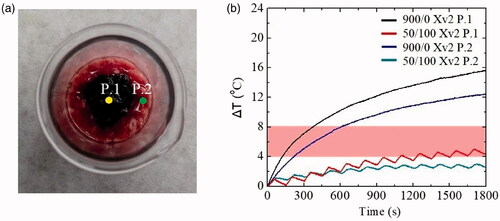
Table 7. Continuous and intermittent mode magnetic field in Xv2 system.
Figure 9. Theoretical approach of the ex vivo model mimicking a tumor–healthy tissue interface (a) point Xv2 P.2 without MNPs, (b) point Xv2 P.1, with MNPs, for both application modes of the AMF. Hyperthermia window is shown with a shaded band.