
Figures & data
Figure 1. Design of an experimental setup to expose a cell suspension (green) to AM-RF-HT [Citation55]. A mean E-field emerges between the electrodes of the capacitor C generated by the voltage VC. The capacitor C in series with an inductivity L (with loss resistance R) establishes a resonance circuit with resonance frequency RF [Citation56]. It is desirable that temperature T (set and maintained using a flow system) and SAR (set by VC) can be selected separately. If the resonance condition f = 2π(LC)1/2 is met, the system is well matched, i.e., in resonance.
![Figure 1. Design of an experimental setup to expose a cell suspension (green) to AM-RF-HT [Citation55]. A mean E-field emerges between the electrodes of the capacitor C generated by the voltage VC. The capacitor C in series with an inductivity L (with loss resistance R) establishes a resonance circuit with resonance frequency RF [Citation56]. It is desirable that temperature T (set and maintained using a flow system) and SAR (set by VC) can be selected separately. If the resonance condition f = 2π(LC)1/2 is met, the system is well matched, i.e., in resonance.](/cms/asset/201c2d8f-f596-4c38-9ddc-c234ffa60acf/ihyt_a_1914354_f0001_c.jpg)
Figure 2. Three-dimensional configuration analyzed by Eibert et al. [Citation108] using sophisticated numerical methods. They found for this special arrangement that the high electrical jump between the extracellular fluid (εr = 70, σ = 1.2 S/m, blue) and fatty or connective deposits (εr = 3, σ = 0.002 S/m, yellow) cause high E-fields of some 1000 V/m (and SAR of 500 W/kg) at a lipid bilayer (membrane) between. Voltages as high as millivolts can be generated in these membrane sections. This analysis is valid for RF > 70 MHz (see dispersion curve in ).
![Figure 2. Three-dimensional configuration analyzed by Eibert et al. [Citation108] using sophisticated numerical methods. They found for this special arrangement that the high electrical jump between the extracellular fluid (εr = 70, σ = 1.2 S/m, blue) and fatty or connective deposits (εr = 3, σ = 0.002 S/m, yellow) cause high E-fields of some 1000 V/m (and SAR of 500 W/kg) at a lipid bilayer (membrane) between. Voltages as high as millivolts can be generated in these membrane sections. This analysis is valid for RF > 70 MHz (see dispersion curve in Figure 3).](/cms/asset/5e281670-069b-42fb-b5c5-477f63706c82/ihyt_a_1914354_f0002_c.jpg)
Figure 3. Frequency dependency (dispersion) of permittivity εr. The plateau with εr ∼ 80 characterizes the conventional RF-HT for APA technology (50 MHz to GHz). The δ-dispersion causes much higher εr of ≈ 1000 at 10 MHz in favor of the capacitive technology. In the TTF range of some 100 kHz εr > 10,000 at arrangements of macromolecules, which might induce huge E-fields under special conditions (see ).
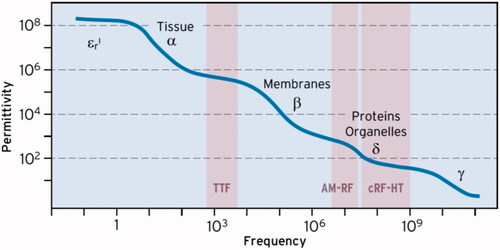
Figure 4. Model of a calcium channel to estimate RCa and GCa that we used as a template for ion channels [Citation112]. The ion channels act like diodes with forward direction along the electrochemical gradient (for calcium from extra- to intracellular). The selectivity filter is magnified for clarification. There is a large electrochemical gradient toward intracellular due to the difference between the membrane potential of -60 mV and the Ca2+ equilibrium potential of 250 mV. High concentration gradients >10,000 predispose cells to excessive calcium influx. Thus, disequilibrium of intra-/extracellular calcium concentrations is more probable for calcium than for other electrolytes.
![Figure 4. Model of a calcium channel to estimate RCa and GCa that we used as a template for ion channels [Citation112]. The ion channels act like diodes with forward direction along the electrochemical gradient (for calcium from extra- to intracellular). The selectivity filter is magnified for clarification. There is a large electrochemical gradient toward intracellular due to the difference between the membrane potential of -60 mV and the Ca2+ equilibrium potential of 250 mV. High concentration gradients >10,000 predispose cells to excessive calcium influx. Thus, disequilibrium of intra-/extracellular calcium concentrations is more probable for calcium than for other electrolytes.](/cms/asset/f95a5f6e-3280-45c7-bd2b-befa6c42b87a/ihyt_a_1914354_f0004_c.jpg)
Figure 5. Left: Typical tumor environment characterized by isolated tumor cells surrounded by extracellular water. Middle: Simplified model of ion channels in the membrane (e.g., potassium) showing the internal pore, cavity and selectivity filter. This model is an archetype for other ion channels. Right: Equivalent circuit diagram of an ion channel according to the ion channel model of . After rectification of the amplitude-modulated (AM) carrier radiofrequency (RF) (∼10 MHz) a low-pass filter (specified by RC) generates a mean DC voltage (1 µV for SAR of 25 W/kg) with a superposed sinus oscillating with the modulation frequency in the kHz range (red solid line). For RF of 10 MHz the condition RC ≫ 10−7 s holds.
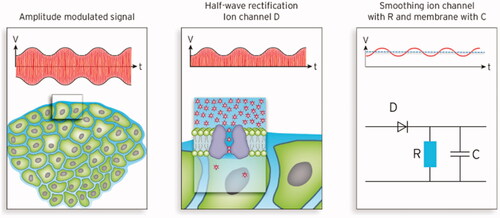
Table 1. Estimated fluxes through ion channels caused by 1 µV either derived applying Ohm’s law or assuming maximal facilitated diffusion (passage in file) and their impact on ion imbalances assuming 1000 channels and 1000 s exposure time resulting in an enhancement factor 106. The highest imbalance is expected for Ca2+ (bold).
Figure 6. Schematics of a single section of the cell membrane that is excited by the ion channel to vibrate. This membrane section perpendicular to the incident wave behaves like a sheet a × b with supported edges. Such a vibratory structure can be excited to natural bending oscillations in the frequency range from hertz to kilohertz depending on the dimensions a, b and the stiffness of the membrane described by the Young’s modulus Y (see text). Excitable tiles with larger extensions can be composed of these sections with an increased number of exciting ion channels. The Eigen frequency declines with increasing dimensions a and b, given in µm.
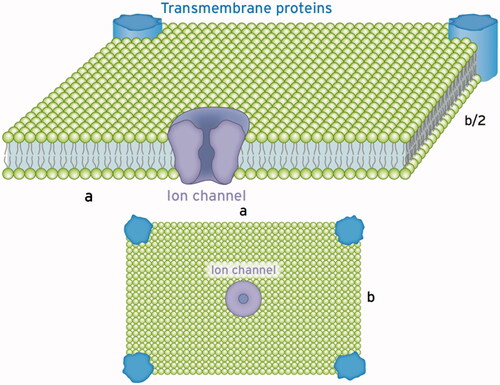
Table 2. Literature data of Young’s modulus for various cell lines comparing normal tissue cells and associated tumor cells arranged according to invasiveness top down.