
Figures & data
Table 1. Thermal exposures were used in this study.
Figure 1. The number of live HCT116 (A) and HT29 (B) cells immediately before, and after, treatment with TIDs of 0, 60, and 120CEM43 up to 96 h. Results are presented as average ± Std. dev of 4 replicates within experiments that have been performed 3 times with similar results.
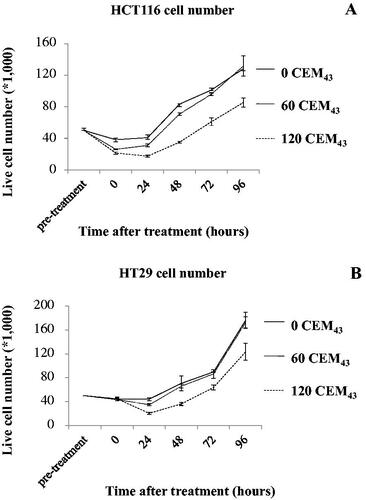
Figure 2. The regulation of biomarkers associated with ICD in HCT116 and HT29 cells exposed to TIDs of 0, 60, and 120CEM43 24 and 48 h after treatment. (A,B) ATP release from HCT116 and HT29 cells. (C,D) Percentage of HCT116 and HT29 cells positive for CALR exposure on their plasma membrane. (E) Percentage of HCT116, and (F) percentage of HT29 cells positive for HSP70 protein on their plasma membrane. (G) Percentage of HCT116, and (H) percentage of HT29 cells positive for HSP90 protein on their plasma membrane. (I-J) Percentage of HCT116 and HT29 cells expressing ‘low’ levels of CD47 on their plasma membrane. Results are presented as means ± Std. dev of at least n = 3 independent experiments. Statistical significance where it exists between cells exposed to a TID of 60 and/or 120CEM43, and cells exposed to a TID of 0CEM43 is denoted with an asterisk ‘, and is assumed at p < .05.
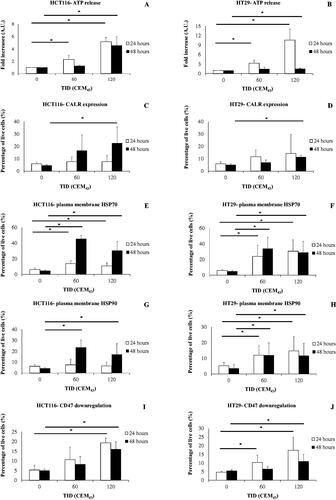
Table 2. Antibodies were used in this study.
Figure 3. The effect of heat on the regulation of intracellular HSP70 and HSP90. (A) Representative immune-blot images of HSP70, HSP90, and ACTIN in HCT116 and HT29 cells exposed to 0, 60, and 120CEM43 24 h after treatment. (B,C) densitometry data of immunoblot images are shown for HSP70 and HSP90 in HCT116 cells (B) and HT29 cells (C). Data are presented as averages ± Std. dev of at least n = 3 independent experiments. Statistical significance where it exists between cells exposed to a TID of 60 and/or 120CEM43, and cells exposed to a TID of 0CEM43 is denoted with an asterisk ‘⋆‘, and is assumed at p < .05.
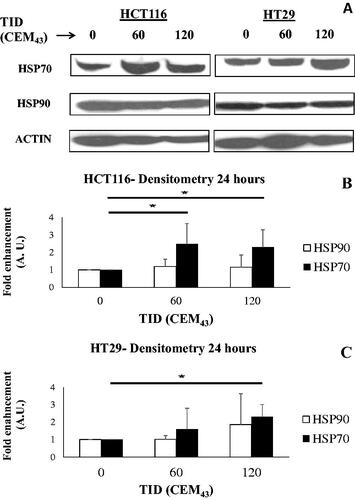
Figure 4. The effect of heat on the regulation of the cell cycle in colon cancer cells. Results of HCT116 (A) and HT29 (B) cell cycle analysis 24 h after treatment with TIDs of 0, 60, or 120CEM43. Results are presented as means ± Std. dev of n = 3 independent experiments. Statistical significance where it exists between cells exposed to a TID of 60 and/or 120CEM43 and sham-exposed cells is denoted with an asterisk ‘⋆‘, and is assumed at p < .05.
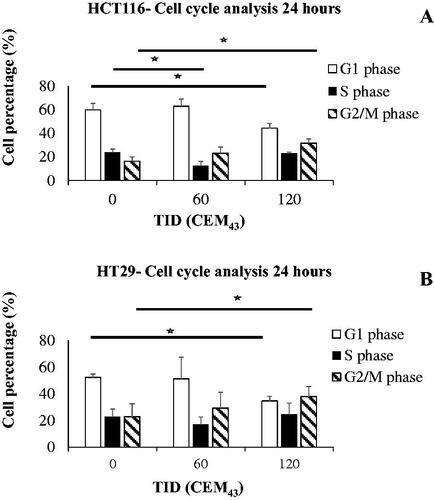
Figure 5. The effect of AUY922 on the viability of heated cells. HCT116 (A) and HT29 cells (B) were exposed to TIDs of 0, 60, 120, and 240CEM43 in the presence of increasing concentrations of AUY922 (0–40 nM). Viability was assessed using the MTT assay 96 h later and results were normalized for the viability of the sham-exposed cells, i.e., those treated with a TID of 0CEM43 in the absence of AUY922. Data are presented as means ± Std. dev of n = 3 independent experiments and statistical significance where it exists for the combined AUY922 and heat treatments compared to the cells exposed to the thermal treatment alone (i.e., no AUY922) is denoted with an asterisk ‘⋆‘, and is assumed at p < .05. For clarity statistical significance has not been shown for cells exposed to heat when compared to the cells sham-exposed to a TID of 0 CEM43.
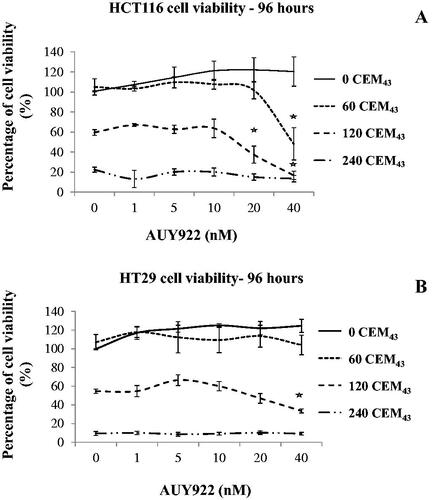
Table 3. Calculation of the combination index (CI) of the combined heat and AUY922 treatments of HCT116 and HT29 cells.
Figure 6. The effect of heat and HSP90 inhibition on PCD and heat shock protein regulation. (A) Representative immune-blot images of intracellular HSP70, HSP90, cleaved PARP, cleaved caspase 3, cleaved caspase 9, and ACTIN in HCT116 and HT29 cells exposed to 0 or 120CEM43 in the presence or absence of AUY922 (40 nM) 96 h after treatment. (B-D) densitometry data of the immunoblot images are shown for HSP70 and HSP90 in HCT116 cells and HT29 cells (B), cleaved caspase 3, cleaved caspase 9, and cleaved PARP in HCT116 (C) and HT20 (D) cells. (E) detection of phosphatidylserine exposure on the cell membrane using Annexin V/PI staining 96 h after the exposure of HCT116 and HT29 cells to 0 or 120CEM43 in the presence or absence of AUY922. Apoptotic cells are shown in the bottom right quadrangle to show Annexin V positive/PI negative cells. Data in (B-D) are presented as averages ± Std. dev of at least n = 3 independent experiments and results for cells treated with heat and/or AUY922 have been normalized for that of the control cells (TID = 0CEM43, AUY922 = 0 nM). Statistical significance where it exists is denoted with an asterisk ‘⋆‘, and is assumed at p < .05. Data in (A) and (E) are presented as representative images of experiments that have been repeated at least 3 times (in (E) twice) with similar results.
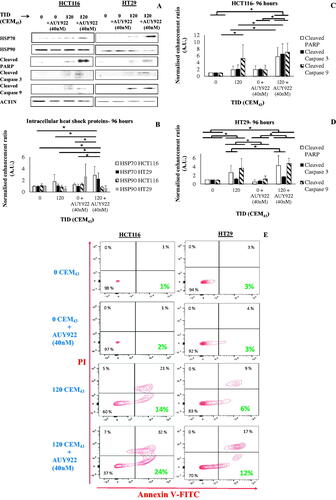
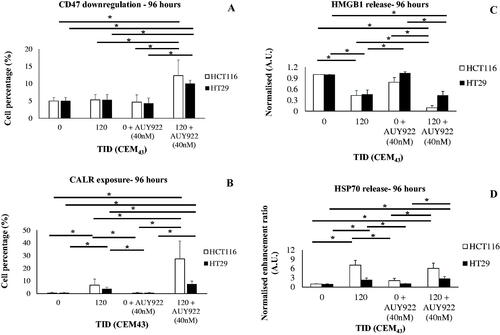
Figure 7. The effect of heat and HSP90 inhibition on the regulation of immune biomarkers. The percentage of HCT116 cells and HT29 cells treated with 0 and 120CEM43 in the presence or absence of AUY922 (40 nM) with ‘low’ levels of CD47 (A) or CALR expression (B) on their plasma membrane, and the release of HMGB1 (C) and HSP70 (D) from the same cells. Results for cells treated with heat and/or AUY922 have been normalized for that of the control cells (TID = 0CEM43, AUY922 = 0 nM) in (C) and (D). Data are presented as means ± Std. dev of at least n = 3 independent experiments and statistical significance is denoted with an asterisk ‘⋆‘, and is assumed at p < .05.
Data availability statement
Remaining data associated with this study are available in the Supplementary material.