Figures & data
Figure 1. Simulated omni-directional applicator microwave specific absorption rate (SAR) cross-sectional (A) and longitudinal (B) plots above images of MWA experiments in ex vivo liver (C,D). The cross-sectional image (C) shows the applicator tract and short axis diameter while the longitudinal image (D) also shows the long axis diameter and the ablation ‘tail.’
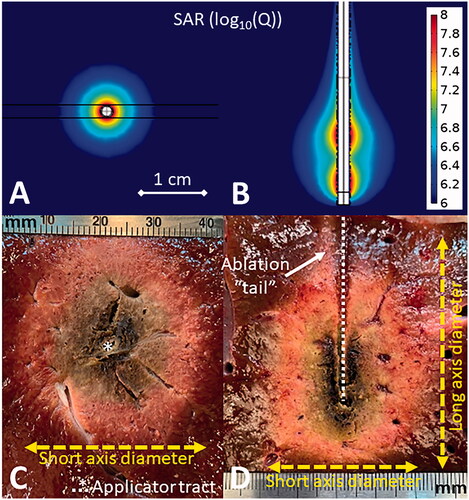
Figure 2. Simulated directional applicator microwave specific absorption rate (SAR) cross-sectional (A) and longitudinal (B) plots above images of DMWA experiments in ex vivo liver (C,D). The cross-sectional image (C) shows the applicator tract, forward ablation depth (df) (yellow dashed line), backward ablation depth (db) (red line), and ablation width (w) (blue dashed line) while the longitudinal image (D) shows forward ablation depth (df) (yellow dashed line) and ablation height (h) (green dashed line).
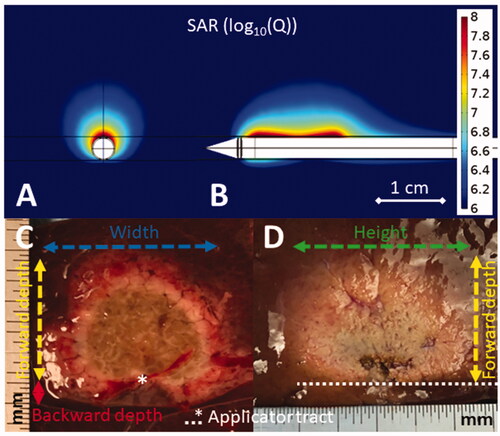
Figure 3. Illustration of DMWA enabled ‘outside-in’ heating approach with an applicator positioned adjacent to and aiming toward the target next to image of ‘outside-in’ ablation experiment in in vivo porcine liver (3 A). Illustration of ‘directional bracketing’ ablation approach next to image of ‘directional bracketing’ ablation experiment in ex vivo bovine liver (3B). Illustration of DMWA ‘surface ablation’ approach for targets near the organ surface (e.g., subcapsular tumors) next to image of image of ‘surface ablation’ experiment in in vivo porcine liver (3 C). Illustration of ‘sector-sweep’ ablation approach to compensate for off-center applicator placement next to image of ‘sector-sweep’ ablation experiment in ex vivo bovine liver (3 D). Illustration of DMWA ‘offset ablation’ approach next to image of image of ‘offset ablation’ experiment in ex vivo bovine liver (3E). Illustration of ‘Combination omni-MWA + DMWA’ approach next to image of image of ‘Combination omni-MWA + DMWA’ ablation experiment in ex vivo bovine liver (3E). For all sub-images the yellow dashed lines indicate the direction of MW radiation.
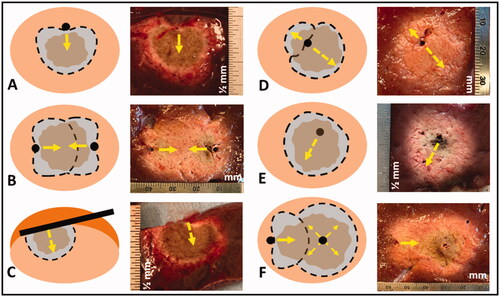
Figure 4. CT image of 1.3 cm para-mediastinal tumor (yellow arrow) adjacent to esophagus in a patient at high risk for surgery (left image). CT image of an induced pneumothorax and ‘chopstick’ technique to treat the tumor with existing cryoablation probes (middle image). Illustration of hypothetical DMWA applicator placement (red dashed line) and direction of microwave emission (orange arrow) to treat the tumor and avoid the esophagus (right image).
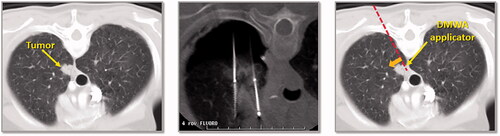
Figure 5. CT image of 1.6 cm lower lobe lung tumor abutting the diaphragm (left image). The challenge in this case is successfully ‘skewering’ the tumor with the ablation applicator without lesion ‘roll-off’ or injury to the diaphragm. CT image of ‘chopstick’ technique to enable treatment of this with existing cryoablation probes (middle image). Two cryoprobes are used; cryoprobe #1 is advanced alongside the tumor and a ‘stick freeze’ is performed to adhere the nodule and enable puncture with cryoprobe #2. Cryoprobe #1 is then thawed and repositioned in the nodule in parallel with probe #2. Illustration of hypothetical DMWA applicator ‘outside-in’ placement (red dashed line) and direction of aim (orange arrow) to treat the tumor and avoid the diaphragm (left image).
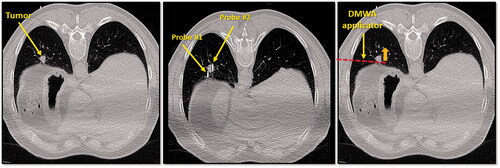
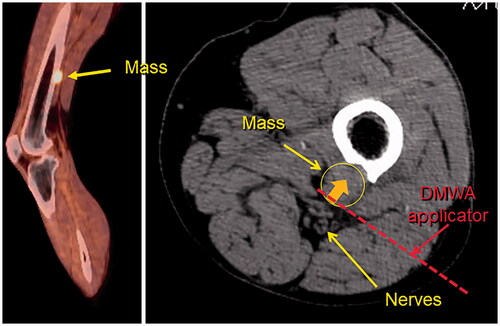
Figure 6. Sagittal fused PET/CT image (left) and axial non-contrast CT image (right) of melanoma metastasis to left femur abutting tibial and peroneal nerves. Illustration of hypothetical DMWA applicator placement (red dotted line) and direction of microwave emission (orange arrow) to treat the tumor and avoid injury to the neurovascular bundle.