
Figures & data
Figure 1. Effect of hyperthermia on the proliferation of MCF-7/ADR breast cancer cells. (A) The protocol of hyperthermia treatment. (B) Cell proliferation after hyperthermia treatment via CCK8 assay. (C) Cell proliferation after hyperthermia treatment via Edu assay. (D) Cell cycle of MCF-7/ADR cell treated with hyperthermia by flow cytometry. (E) Cell apoptosis of MCF-7/ADR cell treated with hyperthermia. Error bars represent the mean ± SD of at least three independent experiments, *p < 0.05, **p < 0.01, ***p < 0.001.
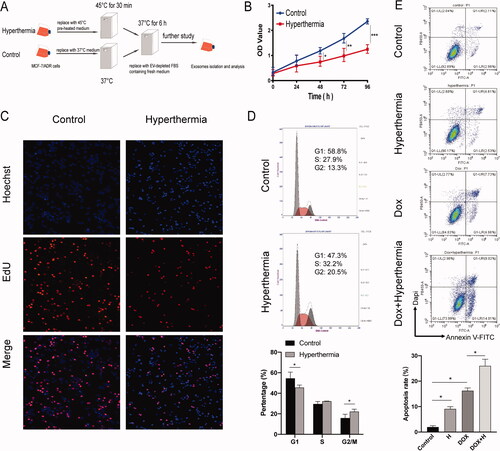
Figure 2. Hyperthermia increases drug sensitivity of MCF-7/ADR breast cancer cells. (A) Cell viability of MCF-7/ADR cell after combination of hyperthermia and adriamycin treatment. (B) Half-inhibition rate of adriamycin in MCF-7/ADR cells after hyperthermia treatment. Error bars represented the mean ± SD of at least three independent experiments, *p < 0.05, **p < 0.01, ***p < 0.001.
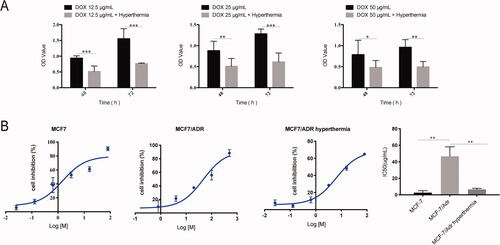
Figure 3. Analysis of microarray data reveals distinct transcriptional profiles by hyperthermia in MCF-7/ADR cells. (A) Scatterplot of differentially expressed genes and sample clustering analysis for all replicates of hyperthermia and control groups. (B) Heat map representation of the expression profiles of genes significantly changed by hyperthermia in MCF-7/ADR cells. The expression level of each transcript is represented by the color range, red indicates high and blue indicates low. Columns indicate arrays and rows indicate genes. (C) The protein-protein interaction (PPI) network of differentially expressed genes (DEGs). The red circle represents the up-regulated genes and the blue circles down-regulated genes. The area of the circle represents the degree. (D) Overall survival analyses of hub genes were performed using Kaplan–Meier analysis. Raw data was normalized within each row. p value < .05, q value < .05, and Fold change > 2.
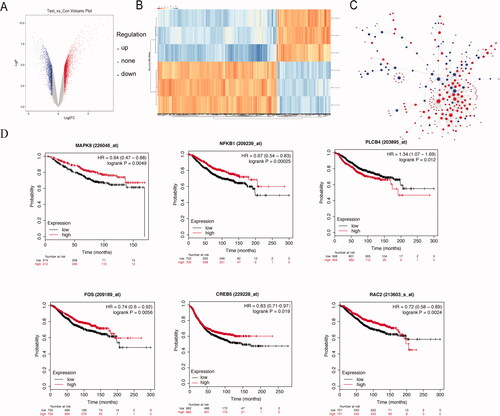
Table 1. List of the top 10 hub genes by hyperthermia treatment.
Figure 4. The validation experiment of hub genes. (A) The differences in gene expression of 10 hub genes were validated with RT-qPCR. (B) Western blot analysis of FOS, CREB5, MAPK8 and NFKB1 protein level. (C) The efficiency of siRNA to knockdown the expression of FOS and CREB5. (D) Cell proliferation in the si-FOS and si-CREB5 group was faster compared with that in the control group, using the CCK-8 assay. (E). Half-inhibition rate of adriamycin in MCF-7/ADR cells treated with si-FOS and si-CREB5. (F) Different expression of FOS and CERB5 between invasive breast cancer and normal breast tissue by TCGA database. Error bars represented the mean ± SD of at least three independent experiments, *p < .05, **p < .01, ***p < .001.
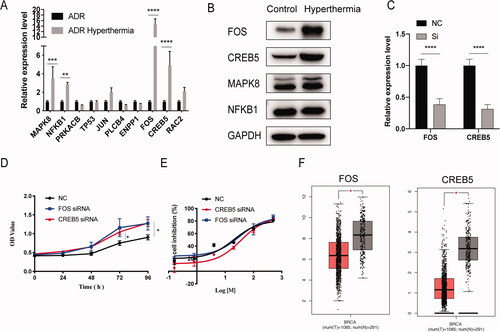
Figure 5. Hyperthermia promotes the secretion of exosome in MCF-7/ADR cells. (A) The expression level of FOS and CREB5 in MCF-7/ADR exosomes after hyperthermia. (B) Half-inhibition rate of adriamycin in MCF-7/ADR cells incubated with the exosomes which produced by MCF-7/ADR cells after hyperthermia. (C) The expression level of FOS and CREB5 in MCF-7/ADR after incubated with hyperthermia ADR/exo. (D) Particles concentration of exosomes derived from breast cancer cells analyzed by NTA. (E) Total protein amounts of exosomes derived from breast cancer cells analyzed by bicinchoninic acid (BCA) protein kit. (F) Transmission electron micrographs (TEM) of cells before or 6 h after hyperthermia. Intense extracellular vesicle shedding occurred 6 h after hyperthermia. Scale bar =1 μm. (G) Confocal microscope analysis of exosome uptake by MCF-7/ADR cells with or without hyperthermia treatment. Scale bar =20 μm. Error bars represent the mean ± SD of at least three independent experiments, *p < .05, **p < .01, ***p < .001.
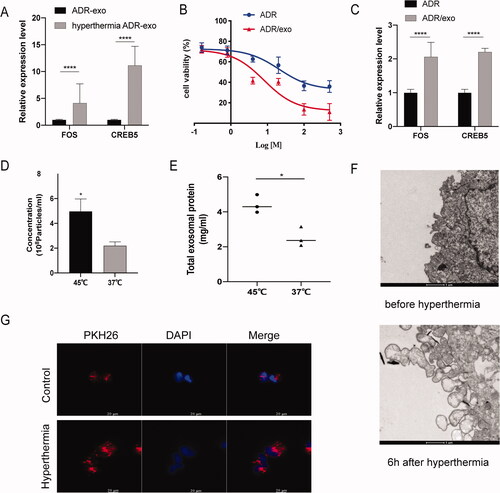
Figure 6. Effects and mechanisms of hyperthermia on EV secretion in breast cancer. (A) The kyoto encyclopedia of genes and genomes (KEGG) pathway enrichment analysis of up-regulated genes. (B) The kyoto encyclopedia of genes and genomes (KEGG) pathway enrichment analysis of down-regulated genes. (C) Effect of hyperthermia on Ras superfamily genes expression. The expression levels were confirmed by RT-qPCR and normalized to the expression of GAPDH. (D) The efficiency examination of three pre-designed siRNAs of Rab7b by RT-qPCR. (E) Particle concentration of exosomes from si-Rab7b cells cultured at 37 °C (mean ± SEM, n = 5) measured by NTA. (F) Total protein of exosomes from si-Rab7b cells cultured at 37 °C (mean ± SEM, n = 5) quantified by BCA kit. (G) Particle concentration of exosomes from si-Rab7b cells preheated at 45 °C (mean ± SEM, n = 5) measured by NTA. (H) Total protein of exosomes from si-Rab7b cells preheated at 45 °C (mean ± SEM, n = 5) quantified by BCA kit. (I) The efficiency examination of pre-designed pcDNA3.1-Rab7b by RT-qPCR. (J) Particle concentration of exosomes from pcDNA3.1-Rab7b cells cultured at 37 °C (mean ± SEM, n = 5) measured by NTA. (K) Total protein of exosomes from pcDNA3.1-Rab7b cells cultured at 37 °C (mean ± SEM, n = 5) quantified by BCA kit. Number of data points per sample was at least three. *p < .05, **p < .01, ***p < .001.
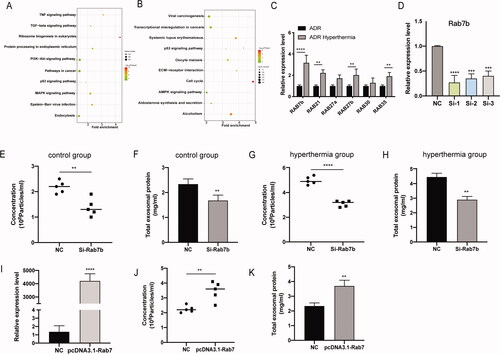
Table 2. List of the 6 Ras superfamily genes changed in hyperthermia group.