Figures & data
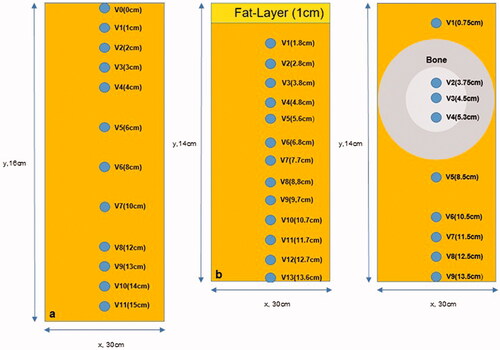
Figure 2. Model of the applicator and phantom setup for the simulations. We variated diameters of the electrodes and dielectric properties εr and σ of the different phantoms (see Figure 1, ) to improve agreement between measurements and simulations.
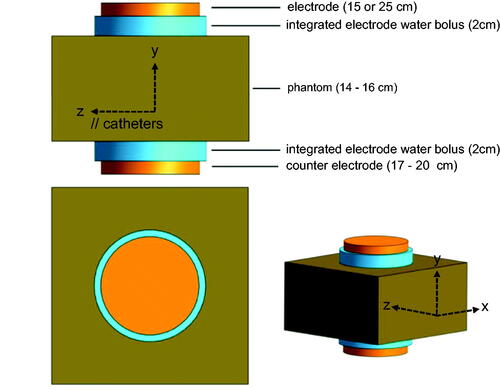
Figure 3. Measurements (left) and simulation (right) in the homogeneous phantom using the symmetrical electrode setup. (a) Measurements (sixfold) of absolute SAR along the central depth profile. (b) Comparison of mean measurements with simulations normalized to V1. The best agreement is achieved, if the asymmetry is considered by an increased bottom electrode with 17 cm diameter (solid line). The simulation predicts SAR nearly twice as high in the central part. The symmetric setup with 15 cm electrodes top and bottom results in a poor agreement. (c, d) Measured SAR distributions (left, T15B15) in comparison to the simulations (right, corrected T15B17). In simulation, dissipated power Pdiss = 200 W was obtained for a voltage of 88 V. While the agreement in the center is satisfactory (depth profiles in b), SAR elevations at the electrode edges are not measured due to the measurement procedure (see text).
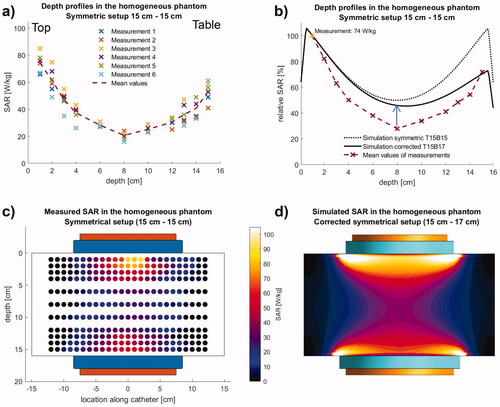
Table 1. Range of dielectric properties er and s [S/m] for the phantom materials and tissues at 13.56 MHz, which is found in the literature (see references) and applied for the simulation studies (see text).
Figure 4. Measurements (left) and simulation (right) in the homogeneous phantom using the asymmetrical electrode setup. (a) Measurements (threefold) of absolute SAR along the central depth profile. (b) Comparison of mean measurements with simulations normalized to the largest measurement in V11. The best agreement is achieved with the actual diameter 25 cm for the top electrode and the increased diameter 17 cm for the bottom electrode (solid line). Like in , the simulations yield SAR twice as high in the central part. (c,d) Measured SAR distributions (left, T25B15) in comparison to the simulations (right, corrected T25B17). In simulation, dissipated power Pdiss = 200 W was obtained for a voltage of 73 V. While the agreement in the center is satisfactory (depth profiles in b), SAR elevations at the electrode edges are not measured due to the measurement procedure (see text). (e) SAR volume histogram for the asymmetrical setup at the bottom electrode (diameter of 17 cm) in a cylindrical volume of diameter 23 cm and 1 cm height. Pdiss = 200 W was obtained for a voltage of 88 V. SAR of >100 W/kg are in a volume of 50 ml and SAR > 50 W/kg in 300 ml. Reactive perfusion and surface cooling determine the final temperature (see Equation 1b and text). A decrease of these values in experiments/treatment is to be expected considering the idealized simulation setup limited to the electrodes and the phantom, neglecting any losses beyond. Nevertheless, if necessary in treatment, the total power of 200 W must be reduced. (f) SAR volume histogram for the symmetrical setup. Pdiss = 200 W was obtained for a voltage of 73 V. At the top electrode (diameter 15 cm) SAR > 100 W/kg are in a volume of 13 ml and SAR > 50 W/kg in
40 ml. Therefore, the risk of overheating is reduced in comparison to the asymmetrical setup.
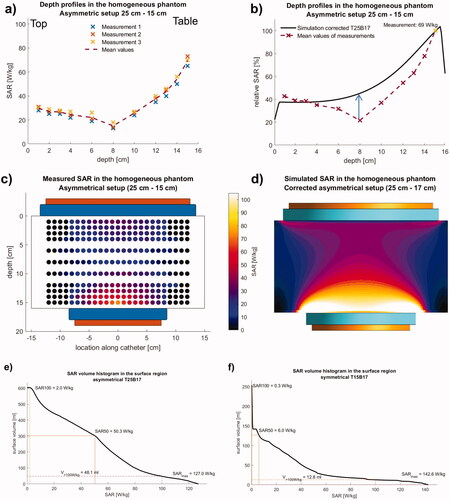
Figure 5. (a) Measurements of absolute SAR along the central depth profile in the phantom with integrated fat layer of 1 cm thickness. V1 (see ) is near at the electrical boundary fat/agarose and is used for normalization. (b) Qualitative agreement between the measured and simulated curves exists but normalization according results in rather large differences between measurements and simulation. (c) Better agreement (solid line) is achieved when shifting the measuring points 6 mm toward the fat layer and assuming minimum values of σ and εr (). Simulations are maximally twice as high in accordance (solid line). For the largest values of σ and εr simulations predict 3–4 times higher SAR (dotted line). We assume that the latter approaches the clinical situation. (d) Nearly the same curves are achieved, if we assume plausible errors for the fat layer thickness and y-coordinates of ±3 mm, i.e., fat layer of 1.3 cm thickness and V1 in 1.5 cm depth.
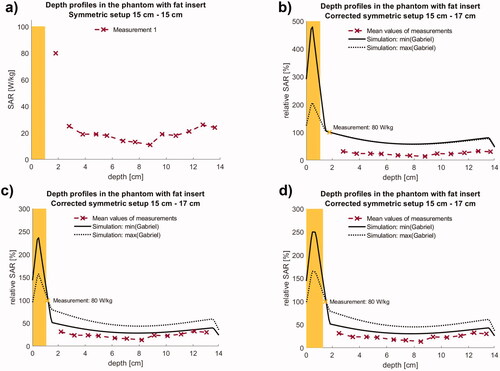
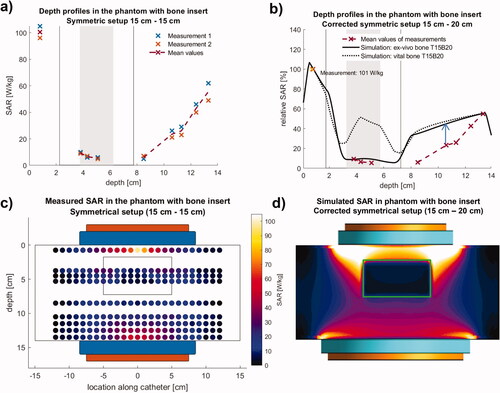
Figure 6. Measurements (left) and simulation (right) in the phantom with bone insert using the symmetrical electrode setup. (a) Measurements (twofold) of absolute SAR along the central depth profile. In the cancellous bone low SAR of 5–10 W/kg are measured. (b) The best agreement is achieved for the dielectric parameters er and s of ex vivo bone () and an increased diameter of 20 cm for the bottom electrode in the table (solid line). Again, simulations are higher (see arrow). For er and s of vital bone distinctly higher SAR of ∼50 W/kg are calculated (dotted line). This confirms the suitability for bone metastases. (c,d) Measured SAR distributions (left, T15B15) in comparison to the simulations (right, corrected T15B20). In simulation, Pdiss = 200 W was obtained for a voltage of 84 V. While the agreement in the center is satisfactory (depth profiles in b), SAR elevations at the electrode edges are not measured due to the measurement procedure (see text).