Figures & data
Figure 1. Schematic cell survival curves for heat alone, radiation alone and combined radiation with heat; the vertical axes have a logarithmic scale. The shape of the survival curves is temperature-dependent: the initial shoulder becomes less pronounced with increasing temperatures, and the slope becomes steeper. Note that exact survival fractions at specific dose levels and temperatures are cell-line dependent.
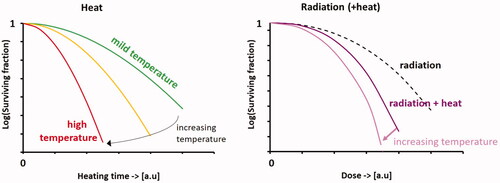
Figure 2. Schematic illustration of the multi-hit repair approach to model response of tumor cells to radiation and heat [Citation57]. The model is based on a chain of cell populations (N 0, …, N k), characterized by the number of radiation-induced damages (‘hits’). At the start of the simulation, the initial population (N0, counted by state variable N0) is clonogenic and can undergo mitosis. During treatment, cells accumulate radiation-induced damage (‘hits’). These damaged cells move to the next population in the chain (green arrows). Damage will be repaired with a certain repair probability, and after successful repair cells move back to a population upward in the chain (black arrows). Hyperthermia reduces this repair capacity. When the damage becomes lethal, cells are removed from the population (red arrows). The final population represents the cells that survived after treatment.
![Figure 2. Schematic illustration of the multi-hit repair approach to model response of tumor cells to radiation and heat [Citation57]. The model is based on a chain of cell populations (N 0, …, N k), characterized by the number of radiation-induced damages (‘hits’). At the start of the simulation, the initial population (N0, counted by state variable N0) is clonogenic and can undergo mitosis. During treatment, cells accumulate radiation-induced damage (‘hits’). These damaged cells move to the next population in the chain (green arrows). Damage will be repaired with a certain repair probability, and after successful repair cells move back to a population upward in the chain (black arrows). Hyperthermia reduces this repair capacity. When the damage becomes lethal, cells are removed from the population (red arrows). The final population represents the cells that survived after treatment.](/cms/asset/a59af299-fed7-4bd7-806f-2a8d4cf3f9fc/ihyt_a_2113826_f0002_c.jpg)
Figure 3. Workflow of X-Term to predict and evaluate equivalent dose distributions for thermoradiotherapy treatments in patients.
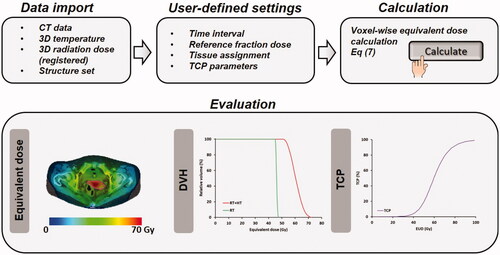
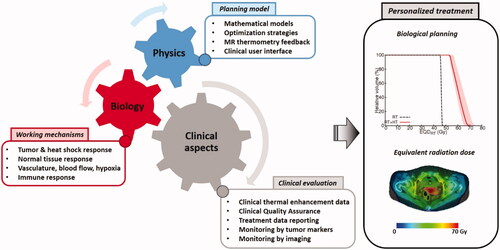
Figure 4. Multidisciplinary research combining biology, physics and clinical aspects will lead to personalized treatment using biological modeling to optimize thermoradiotherapy treatments. This reflects the ongoing research within the large European Hyperboost consortium (European Horizon 2020 MSCA-Innovative training network grant 955625).