Figures & data
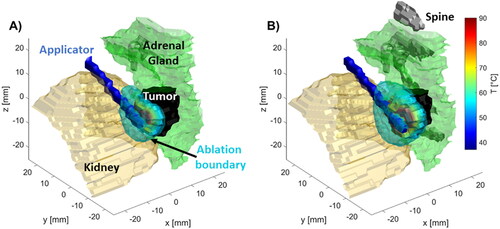
Figure 1. (A) Example CT image illustrating MWA applicator insertion path, adrenal gland, and adjacent structures. (B) computational model representing this case constructed from the segmented tissue regions and application position.
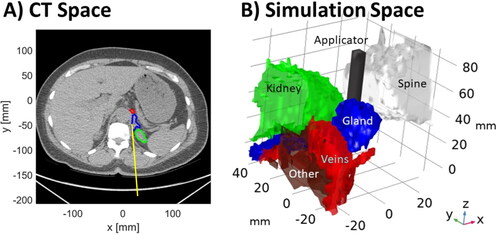
Table 1. Tissue biophysical properties employed in FEM simulation at 2.45 GHz.
Table 2. Acceptable volumes of collateral damage in different organs.
Table 3. Summary data for 14 simulated APA microwave ablation cases and ablation boundary estimated by threshold of 240 CEM43.
Figure 2. Specific absorption rate in tissues near applicator in (A) radial, and (B), (C) longitudinal (B), (C) slices along the applicator (white space) as well as D) 3D visualization of applicator (blue), tumor (temperature map), kidney (beige), spine (white) and other (purple) with SAR map overlaying tumor volume.
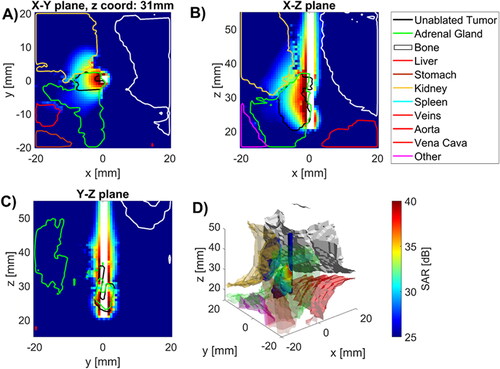
Figure 3. Temperatures in tissues near applicator in (A) radial, and (B), (C) longitudinal (B), (C) slices along the applicator (white space) as well as (D) 3D visualization of applicator (blue), tumor (temperature map), kidney (beige), spine (white) and other (purple) with temperature map overlaying tumor volume.
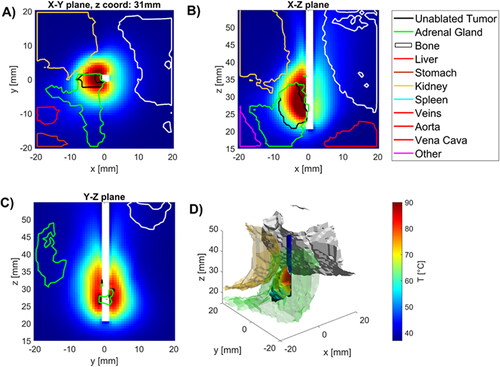
Figure 4. Thermal profiles for case 10 at the termination time of t = 90 s. The ablation applicator axis is approximately perpendicular to the long axis of the tumor, resulting in substantial fraction of the ablation zone extending beyond the target in one direction, but lateral extents of the target volume remaining unablated. The ablation duration is limited by unacceptable collateral damage in structures like the adjacent pancreas and intestines (see ).
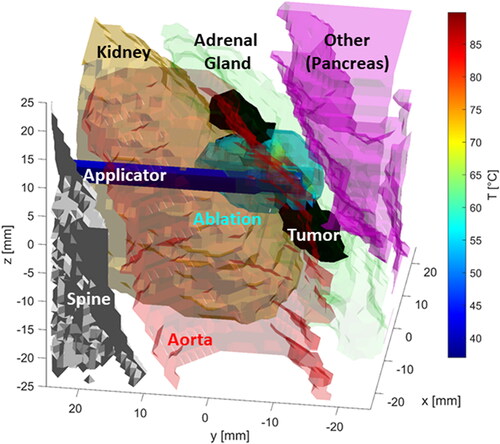
Figure 5. Illustration of the impact of applicator positioning relative to the adrenal gland on thermal profiles. (A) Applicator is approximately 1.5 mm away from the adrenal gland/tumor, separated by a layer of peri-adrenal fat (tumor coverage: ∼48%) (B) The applicator is adjacent to the adrenal gland/tumor boundary (tumor coverage: ∼79%).