
Figures & data
Table 1. Study sample characteristics.
Figure 1. Example ROI placement for intensity and CNR analysis between the IVIM-based non-perfused volume (NPV) and surrounding tissue. This example shows an -map calculated with least-squares fitting without T2-correction.
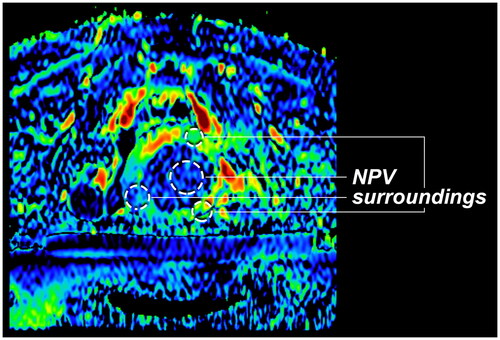
Figure 2. Diffusion weighted imaging (DWI) b-value images (first two rows) and IVIM perfusion fraction maps (lower rows) of a uterine fibroid before and after MR-HIFU treatment, generated using conventional least squares () and neural net (
) fitting techniques, and a T2-uncorrected (
) and T2-corrected (
) IVIM model. Based on the contrast enhanced-T1w (CE-T1w) scan, the fibroid’s perfusion has been successfully eliminated in this patient. This seems to be accurately reflected on the post-HIFU perfusion fraction maps, as perfusion fraction is decreased within the fibroid in comparison to screening. The HIFU-transducer, which is located in an oil tank, is visible in the post-HIFU DWI and perfusion fraction maps and marked in the post-HIFU b0 DWI image. During treatment, the patient lies prone on a membrane on top of the transducer.
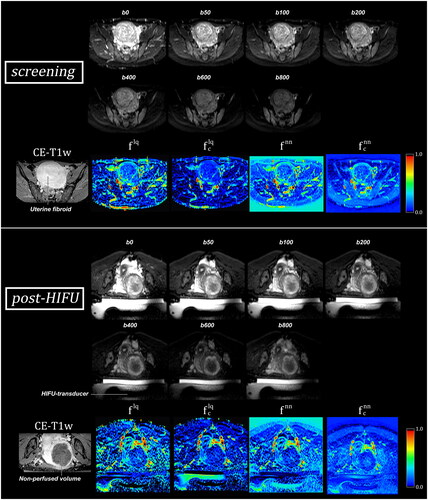
Figure 3. Mean perfusion fraction (/
) in IVIM perfusion fraction maps, between the area with low perfusion fraction in the treated fibroid and surrounding tissue, after an MR-HIFU treatment. All four types of IVIM perfusion fraction maps showed a significant difference in perfusion fraction between low-value area and surrounding tissue.
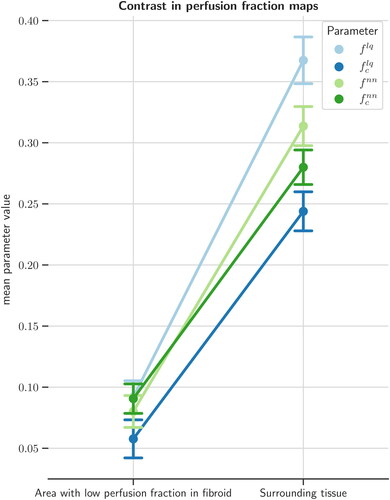
Figure 4. Contrast-to-noise (CNR) analysis between the low-value area in the treated fibroid and surrounding tissue in IVIM perfusion fraction (/
) maps. The CNR was not significantly different for any of the perfusion fraction map combinations.
= least squares,
= neural net,
= T2 corrected.
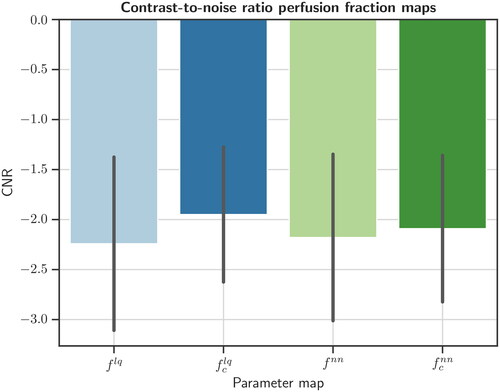
Figure 5. Bland-Altman plot of areas with low perfusion fraction (/
) measured on perfusion fraction maps and non-perfused areas on reference contrast enhanced T1-weighted scans, immediately after MR-HIFU treatments of uterine fibroids.
= least squares,
= neural net,
= T2 corrected.
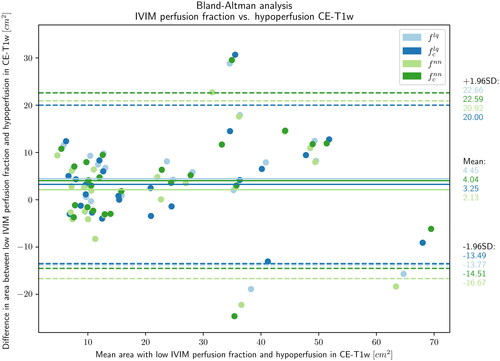
Table 2. Dice similarity coefficient between perfusion fraction maps and contrast-enhanced T1-weighted MRI.
Supplemental Material
Download Zip (1.2 MB)Data availability statement
The clinical, imaging and treatment data is not publicly available, as the study participants did not give consent to share their data publicly with third parties.