Figures & data
Figure 1. Microwave hyperthermia or radiotherapy devices were used for in vitro and in vivo experiments. (A) An X-RAD225 Biological Irradiator. (B) Cell culture plates in the irradiator. (C) Prostate cancer (P Ca) nude mice in the irradiator. (D) A microwave hyperthermia device. (E) Cell culture plates under the MW generator. (F) P Ca nude mice under the MW generator. (G) Schematic diagram of MW-HT starting work according to temperature. (H) The change trend of frontal temperature and rectal temperature with MWHT work. (J) The change trend of tumor epidermal temperature and tumor core temperature with MW-HT work.
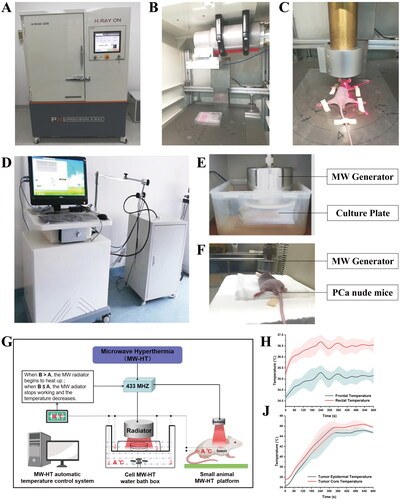
Figure 2. Experimental results of hyperthermia sensitization radiotherapy in vivo. (A) Schematic illustration of the in vivo experimental design. (B–C) Frontal and graft skin temperature of P Ca-bearing nude mice during microwave hyperthermia. (D) Body weight of mice in each group during microwave hypothermia (MW-HT) combined with radiotherapy (RT). (E) Relationship between primary tumor volume and days after different treatments. (F, G, H) Tumor weight and photographs of different treatment groups at the end of the experiment. The all data are expressed as the mean ± SD, n = 3–5, #P < 0.05 or ##P < 0.01 compared to the control, *P < 0.05 or **P < 0.01 compared to 10 Gy + MW-43 °C.
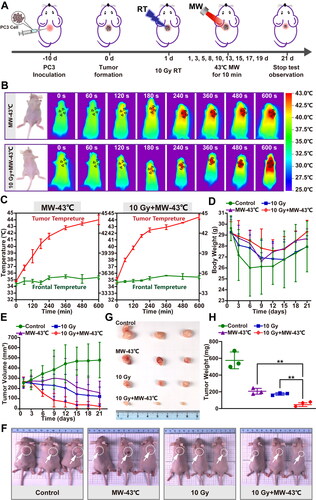
Figure 3. Inhibitory effect of radiotherapy on PCa PC3 cells AND in vitro radiosensitization effect of MW-HT. (A) Inhibitory effect of different radiation doses on the proliferation of P Ca P C3 cells analyzed using the CCK-8 assay. (B, C) Cloning of P C3 cells under different radiation doses. (D) The combined effect of MW-HT and 4Gy on the proliferation inhibition of P C3 cells was detected using the CCK-8 method. (E) Clonogenic survival of P Ca P C3 cells. The cells were exposed to X-ray irradiation and then treated with MW-HT. Subsequently, cells were incubated for two weeks and the number of colonies with >50 cells was scored. A multi-target click mathematical model simulated the P Ca P C3 cell SF curve. (F–G) Cloning of P Ca P C3 cells with MW-43 °C combined with RT-4Gy.The results are expressed as the mean ± SD, n = 6, **P < 0.01 or ***P < 0.001 compared to 4 Gy + MW-43 °C.
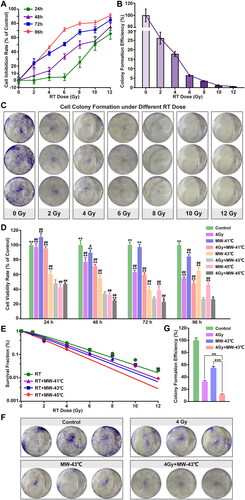
Figure 4. Effect of MW-HT with RT on ROS levels and DNA damage in PCa PC3 cells. (A) Representative photographs of DCF fluorescence staining of P C3 cells. Scale bar = 200 μm. (B): Quantitative analyses of the mean fluorescence intensity. The data are expressed as the mean ± SD, n = 6, ##P < 0.01 compared to control, **P < 0.01 or ***P < 0.001 compared to 10 Gy + MW-43 °C. (C) The comet assay was used to investigate the effects of combining MW-HT and RT-4 Gy on DNA fragmentation in P Ca P C3 cells, Scale bar = 200 μm. (D) Mann-Whitney Rank Sum test were used to compare the difference between Control, 4Gy, MW-43 °C and MW-43 °C + 4Gy groups, ***P < 0.001 compared to 4 Gy + MW-43°C.
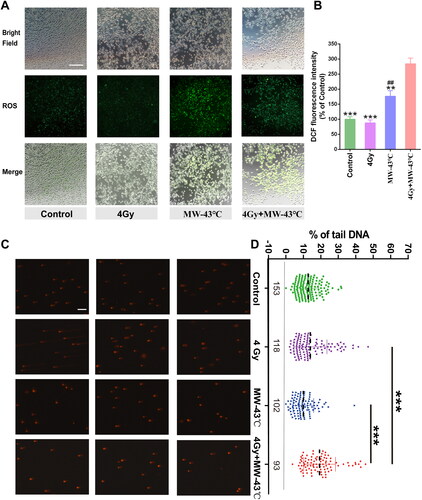
Figure 5. Combined treatment with MW-HT and RT induces apoptosis by inhibiting ATM/ATR- Chk2/Chk1 and Ku70/ Ku80-DNA-PKcs-P53-P21 signaling pathways in PC3 cells. (A) Effect of combined treatment with MW-HT and RT on apoptosis of P Ca P C3 cells. Scale bar = 10 μm. (B) Graphs showing the quantification of apoptotic bodies in P C3 cell. Data are expressed as the mean ± SD, n = 6. (C–E) Western blot analysis of the signaling pathway-related proteins of DNA-P KCs, AT M, AT R, and P53/P21 in P C3 cells. GAP DH expression was included as an internal control. Data are expressed as the mean ± SD, n = 3. #P < 0.05 or ##P < 0.01 compared to control, *P < 0.05 or **P < 0.01 compared to 10 Gy + MW-43°C.
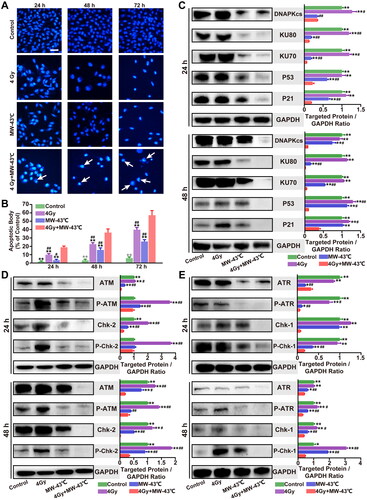
Figure 6. Combined treatment with MW-HT and RT induces apoptosis by inhibiting ATM/ATR-Chk2/Chk1 and Ku70/ Ku80-DNA-PKcs-P53-P21 signaling pathways in vivo. (A) H&E, Ki-67, and T UNEL staining of tumor tissues in different treatment groups. Scale bar = 50 μm. (B) Ki-67 positive cells were detected by immunohistochemistry and analyzed using the Image-ProPlus 6.0 software. (C) Cell apoptosis rate was calculated as the percentage of T UNEL-positive cells relative to the total cells and analyzed using the Image-ProPlus 6.0 software. (D–E) Western blot analysis of the signaling pathway-related proteins of DNA-P KCs, AT M, AT R, and P53/P21 in vivo. GAP DH expression was included as an internal control. Data are expressed as the mean ± SD, n = 3–5, #P < 0.05 or ##P < 0.01 compared to control, *P < 0.05 or **P < 0.01 compared to 10 Gy + MW-43°C.
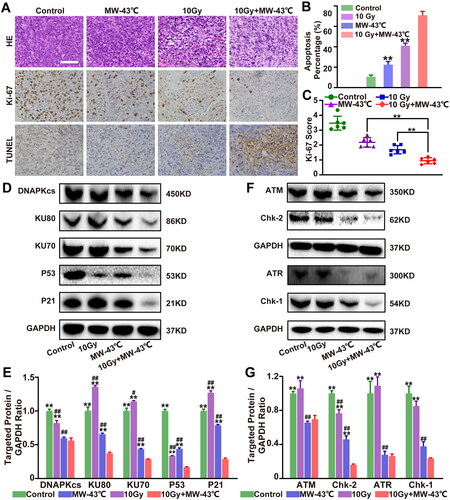
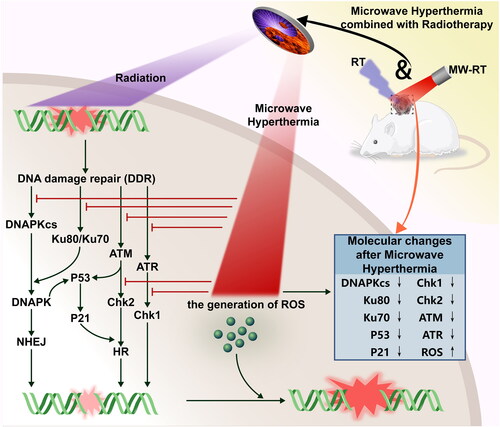
Figure 7. Schematic illustration of the treatment process of radiotherapy with microwave hyperthermia sensitivity for PCa and the associated radio-sensitive mechanism. This study found that MW-HT sensitization mainly includes the following parts: (1) MW-HT can induce the increase of ROS in P Ca cells, thereby reducing the RT resistance of hypoxic tumor cells and inducing apoptosis of P Ca cells. (2) MW-HT effectively prevents RT-induced DNA damage repair (by NHEJ and HR) by downregulating DNA-P Kcs and AT M signaling pathways, thereby sensitizing the RT effect. (3) MW-HT can inhibit the AT R signaling pathway and downregulate P53/P21, thereby blocking cell cycle to inhibit DNA damage repair and promote apoptosis of P Ca cells.