Figures & data
Table 1. Participant characteristics.
Table 2. Neuropsychological test performance in control and TBI groups.
Figure 1. Saccadic target detection in the Fusion n-Back Test. Task was performed across multiple conditions: Low Load (Simple Response Time; press a single button [all target circles were white]), Moderate Load (0-Back/Colour Discrimination; press a button representing green vs. blue current target circle) and High Load (1-Back/Working Memory; press a button representing same vs. different colour of current target circle relative to the previous target circle).
![Figure 1. Saccadic target detection in the Fusion n-Back Test. Task was performed across multiple conditions: Low Load (Simple Response Time; press a single button [all target circles were white]), Moderate Load (0-Back/Colour Discrimination; press a button representing green vs. blue current target circle) and High Load (1-Back/Working Memory; press a button representing same vs. different colour of current target circle relative to the previous target circle).](/cms/asset/b8d54ba1-6290-48d2-9e18-49fe5057faea/ibij_a_1511067_f0001_b.gif)
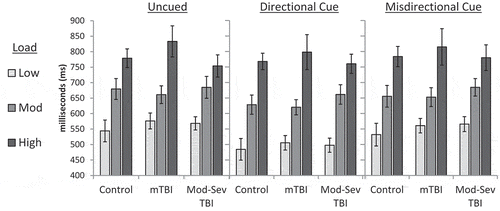
Figure 2. Saccadic RT on the Fusion n-Back Test by group, cue type and cognitive load. mTBI = Mild TBI; Mod-Sev TBI = Moderate-Severe TBI. Error bars represent SE. Main effect of Group was significant, p = 0.04, ηp2 = 0.11; pairwise between-group differences are noted with * for p < .05 and ^ for p < 0.10. Significant effects were also present for Cue (ηp2 = 0.07, p = 0.03), Load (ηp2 = 0.12, p = 0.002); and a Group*Load interaction (ηp2 = 0.09, p = 0.048); pairwise comparisons not shown. For the Mild TBI and Moderate-Severe TBI groups only, saccadic RT was significantly slower in the high load (1-Back) condition than in the low (Simple RT) and moderate (0-Back) load conditions (p ≤ 0.03 for all).
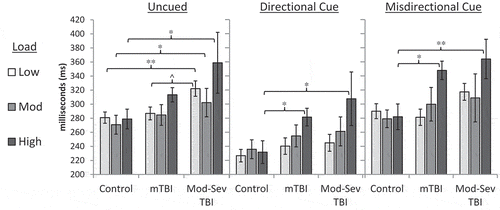
Figure 3. Overall Saccadic RT on the Fusion n-Back Test by group. mTBI = Mild TBI; Mod-Sev TBI = Moderate-Severe TBI. Error bars represent SE. Main effect of Group was significant, p = 0.04, ηp2 = 0.11.
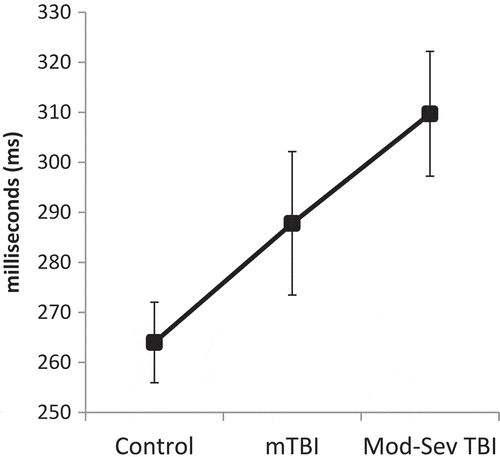
Figure 4. Manual RT on the Fusion n-Back Test by group, cue type and cognitive load. mTBI = Mild TBI; Mod-Sev TBI = Moderate-Severe TBI. Error bars represent SE. No significant main effect or interaction was demonstrated for group. Significant main effects were present for cue (ηp2 = 0.13, p < .001) and load (ηp2 = 0.17, p < .001); pairwise comparisons not shown.