Figures & data
Figure 1. Schematic drawing of the four visuomotor conditions.
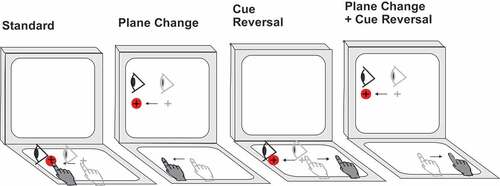
Table 1. Median scores between groups (PCS, healthy control) on kinematic variables of each visuomotor task condition.
Table 2. Correlation significance summary matrix for all relationships analyzed in the study. Light/dark red shading indicates positive correlations significant at the ρ = 0.05 /0.01 level, light/dark blue shading indicates negative correlations significant at the ρ = 0.05 /0.01 level, green/white shading indicates no significant difference at α = 0.05. For cortical structural correlationsCitation1,Citation17), lower left boxes indicate volume, upper right boxes indicate thickness. Only cerebellar lobules that showed significant group differences are included (Citation21,Citation24–)
. *:plane change condition, **:cue reversal condition, †:plane change & cue reversal condition. Tangerine cells with dark borders show correlations with behavioral performance.
Figure 2. Relationship between the volume of the right precuneus and trajectory performance on the plane change + cue reversal condition.
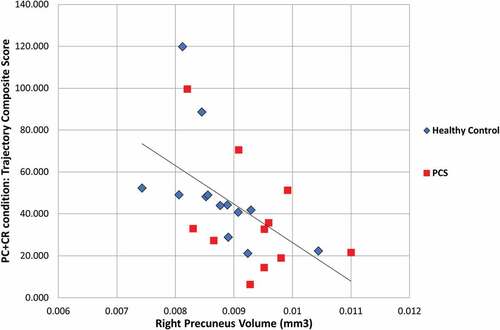
Figure 3. Relationship between the volume of the left VIIIa lobule and timing performance on the cue reversal condition.
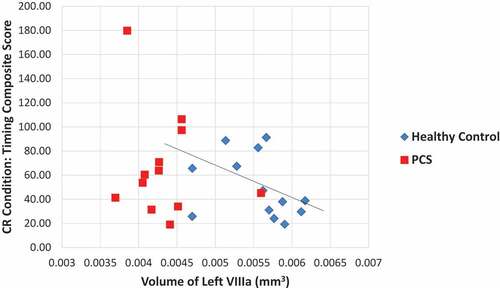
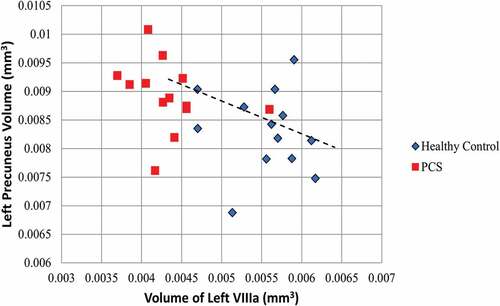
Figure 4. Relationship between the volume of the left VIIIa lobule and the volume of the left precuneus.