
Figures & data
Table 1. Demographic characteristics of participants at 5-Year Follow-up.
Figure 1. FrSBe T-scores at 5-Year follow-up for blast mild TBI and non-blast controls.
Note. a) FrSBe Total T-scores; p < .001. b) FrSBe Apathy T-scores; p < .001. c) FrSBe Disinhibition T-scores; p < .001. d) FrSBe Executive Dysfunction T-scores; p < .001.
Dashed horizontal line = Clinical elevation threshold of T > 65
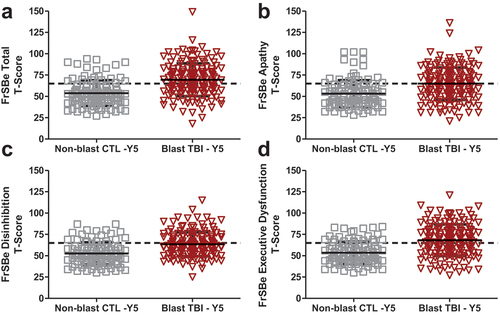
Figure 2. FrSBe T-scores at 1-Year follow-up for blast mild TBI and non-blast controls.
Note. a) FrSBe Total T-scores; p = .001. b) FrSBe Apathy T-scores; p = .007. c) FrSBe Disinhibition T-scores; p = .001. d) FrSBe Executive Dysfunction T-scores; p = .001.
Dashed horizontal line = Clinical elevation threshold of T > 65
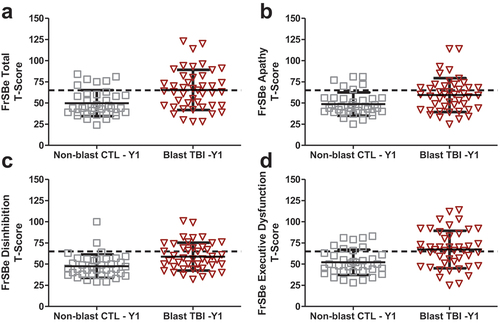
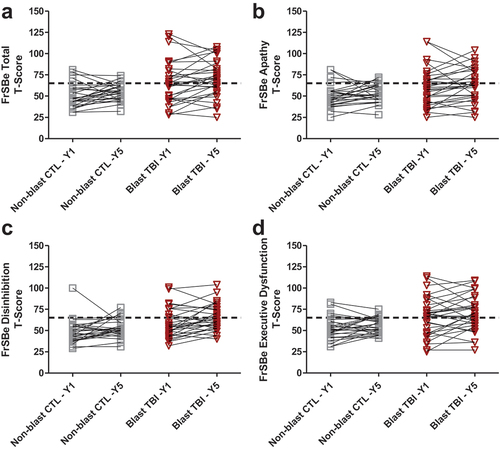
Figure 3. Change in FrSBe T-scores from 1-Year to 5-year follow-up for blast mild TBI and non-blast controls.
Note. a) FrSBe Total T-scores; Non-blast controls, p = .094, Blast mild TBI, p = .080. b) FrSBe Apathy T-scores; Non-blast controls, p = .182, Blast mild TBI, p = .236. c) FrSBe Disinhibition T-scores; Non-blast controls, p = .089 Blast mild TBI, p = .015. d) FrSBe Executive Dysfunction T-scores; Non-blast controls, p = .186, Blast mild TBI, p = .172.
Dashed horizontal line = Clinical elevation threshold of T > 65
Supplemental material