449
Views
0
CrossRef citations to date
0
Altmetric
Research Article

Feasibility of a novel blended-care intervention for fatigue after acquired brain injury: a pilot study of the Tied by Tiredness intervention

ORCID Icon, , , &
Pages 448-458 | Received 30 Apr 2023, Accepted 24 Jan 2024, Published online: 07 Feb 2024

Figures & data

Figure 1. Example of a feedback graph for level of fatigue over the intervention period (6 weeks, 3 days per week).

Note. Each point represents a fatigue rating by the participant within a day and lines that connect these dots represent separate measurement days. For example, the data in the circle represent Day 1 of the first week, during which the participant provided four fatigue ratings. During treatment sessions, the therapist can zoom in on individual days or weeks and plot extra information in the graph (e.g., concurrent mood) to get personalized insights into fatigue and its related factors.
Figure 1. Example of a feedback graph for level of fatigue over the intervention period (6 weeks, 3 days per week).

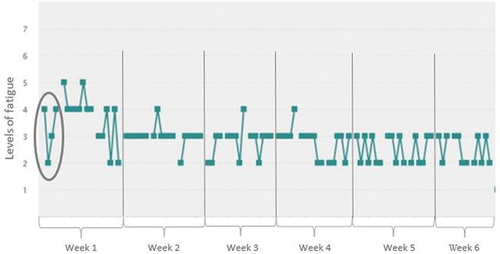
Table 1. Tied by tiredness intervention treatment modules.

Table 3. Weekly number of signals responded to (out of 24) and corresponding response rate in percentage per participant.

Table 2. Demographics of participants.

Table 4. Evaluation questionnaire about usability app, 7-point likert scale with 1 ‘not at all’ and 7 ‘very’.

Table 5. Evaluation questionnaire about the intervention, 7-point likert scale with 1 ‘not at all’ and 7 ‘very’.

Figure 2. Weekly average of momentary fatigue rating per participant and the mean of the three fatigue measurements.

Figure 2. Weekly average of momentary fatigue rating per participant and the mean of the three fatigue measurements.

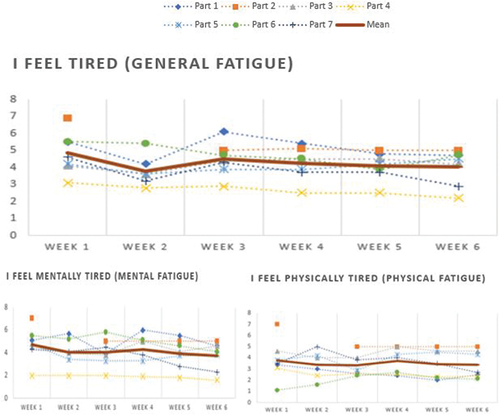
Table 6. Weekly average of momentary fatigue rating per participant on a 7-point likert scale and the average of the three types of fatigue ratings.