
Figures & data
Figure 1. The Speech Disorders Classification System (SDCS).
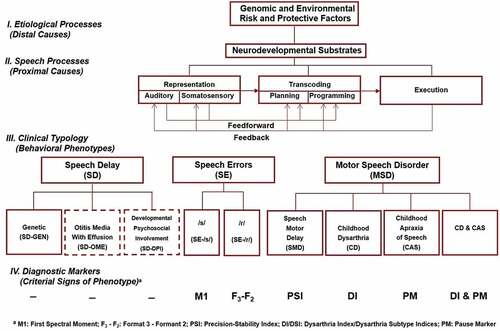
Table 1. Assessment, demographic, cognitive-language, and speech information for participants in six groups of children in six USA cities recruited for idiopathic SD. The groups are listed in descending order by the number of participants in each original sample. Cell values and percentages for demographic, cognitive-language, and speech variables are for the 415 of the original 448 (93.5%) participants that were able to be classified using the SDCSS.
Table 2. The five speech classifications and five motor speech classifications in the SDCS are each mutually exclusive. The five dysarthria subtype classifications are not mutually exclusive. That is, a speaker can meet percentile criteria for more than one of the five listed dysarthria subtype classifications (i.e., mixed dysarthria). See Supplement for the procedures and measures used to classify each motor speech disorder.
Figure 2. Sample output from the Speech Disorders Classification System Summary (SDCSS). The upper SDCSS includes cross-classification findings for a family member with a disruption in FOXP2 (Shriberg et al., Citation2006). The lower SDCSS includes speech and motor speech cross-classification findings for 45 speakers with Down syndrome (Wilson et al., Citation2019).
Table 3. Reliability estimates for interjudge and intrajudge agreement for phonetic transcription, prosody-voice coding, and acoustic analyses.
Figure 3. Speech and motor speech classification prevalence estimates from six samples of children (n = 415) recruited for idiopathic speech delay.
Table 4. Summary of dysarthria subtype findings for the 14 participants who met Speech Disorders Classification System criteria for childhood dysarthria.
Table 5. Estimates of the prevalence of idiopathic MSD. Estimates of the prevalence of MSD in idiopathic SD are from the present study. Estimates of the prevalence of idiopathic SD are from studies in Australia, England, and the USA.