
Figures & data
Table 1. PDP and PDT counts and percent by CV and CV articulatory classification used in the logistic regression modelling.
Figure 1. Mean PDP for production for each CV in decreasing order. The pareto line shows cumulative PD.
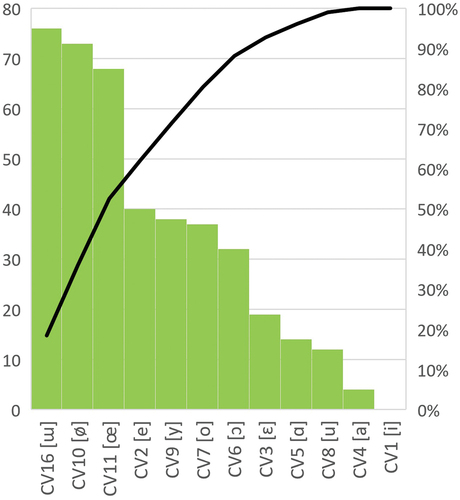
Figure 2. Boxplots of PDP by articulatory classification: (a) frontness, (b) openness, (c) lip posture and (d) CVSet.
Figure 3. Odds ratio plot illustrating the effect of CV features on PDP in the full model. FRT = front, BCK = back, CL = close, CM = close-mid, OM = open-mid, OP = open, SPR = spread, NTR = neutral, RND = rounded, PRM = primary CV, SCD = secondary CV.
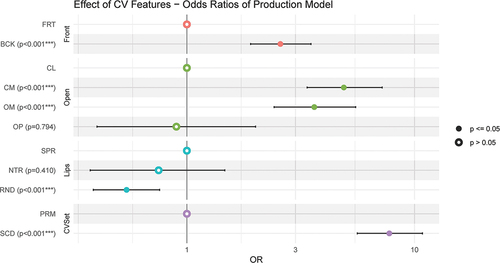
Table 2. Output of logistic regression full model for PDP. The intercept is the front close spread CV1 [i].
Table 3. Comparison of null model, simplified model and full model for PDP.
Figure 4. Mean PDT for production for each CV in decreasing order. The pareto line shows cumulative PDT.
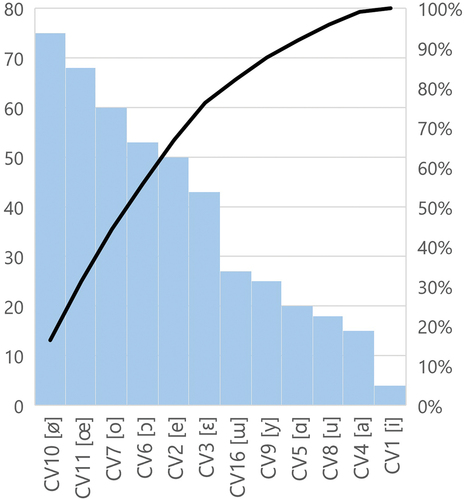
Figure 5. Boxplots of PDT by articulatory classification: (a) frontness, (b) openness, (c) lip posture, and (d) CVSet.
Figure 6. Odds ratio plot illustrating the effect of CV features on PDT in the full model. FRT = front, BCK = back, CL = close, CM = close-mid, OM = open-mid, OP = open, SPR = spread, NTR = neutral, RND = rounded, PRM = primary CV, SCD = secondary CV.
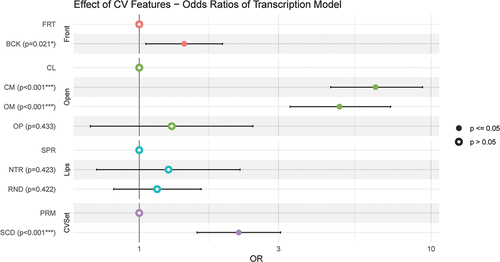
Table 4. Output of logistic regression full model for PDT. The intercept is the front close spread CV1 [i].
Table 5. Comparison of null model, simplified model, and full model for PDT.
Figure 7. Cluster dendrogram.
Data availability statement
The data that support the findings of this study are available from the author upon reasonable request.