1,233
Views
2
CrossRef citations to date
0
Altmetric
Articles

Airwave oscillometry and spirometry in children with asthma or wheeze

, BMBCh, , BESS, , MRes, , PhD, , PhD & , MDORCID Icon
Pages 1153-1161 | Received 01 Aug 2022, Accepted 07 Oct 2022, Published online: 08 Nov 2022

Figures & data

Table 1. Demographics of study population.

Figure 1. Bland-Altman plot for FEV1 z-scores paired with R5 z-scores, Regression equation: y = −0.73 + 1.6x.

Figure 1. Bland-Altman plot for FEV1 z-scores paired with R5 z-scores, Regression equation: y = −0.73 + 1.6x.

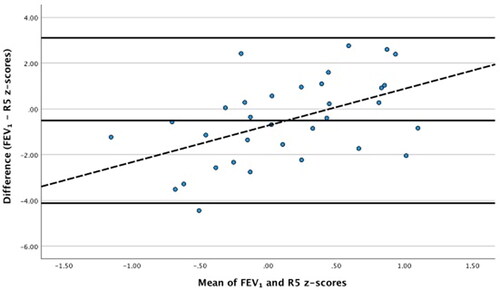
Table 2. Correlation of AOS parameters and spirometry parameters at baseline.

Table 3. Correlation of delta change in AOS and delta change in spirometry results.