
Figures & data
Figure 1. The dysregulated CRGs in AA. (A) The location of 13 CRGs on a chromosome. (B) The expression patterns of CR-DEGs. (C) The CRGs boxplot in AA.
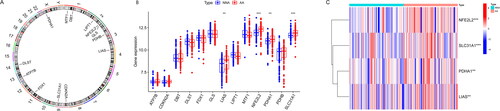
Figure 2. Immunogene set analysis of immune infiltration patterns in AA and NNA conditions. (A) Heatmap exhibiting the immunogene sets in AA and NNA groups. (B) Boxplot showing the difference in infiltrating immune cells between AA and NNA groups. (C) A correlation heatmap visualizing the relationship between SLC31A1, PDHA1, LIAS, and NFE2L2 and immune cells.
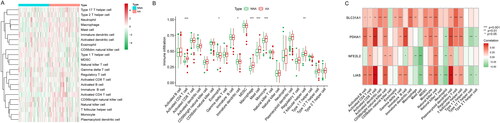
Figure 3. The correlation between immune cells and cuproptosis in AA. (A) UMAP visualization of cell clusters in AA samples. (B) Bubble chart of cell cluster assignment following UMAP-based visualization of expression. (C) Percentage of various cell clusters in allergen, diluent and baseline samples. (D) The expression of cuproptosis module scores in immune cells.
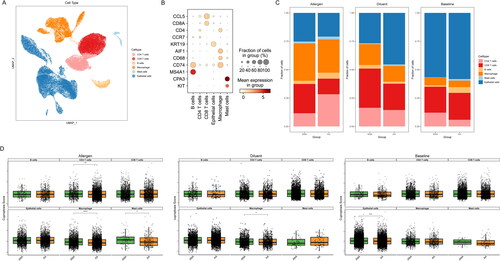
Figure 4. The developmental trajectory of 3 immune cells. UMAP visualization of the developmental trajectory of CD4+ T cells (A), macrophages (B) and mast cells (C). (D-F) The expression of 4 CRGs in CD4+ T cells (D), macrophages (E) and mast cells (F).
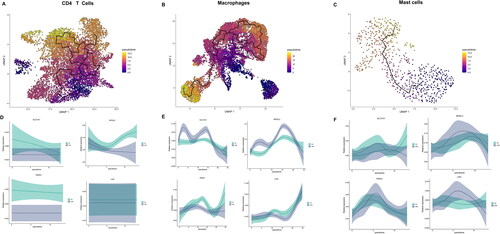
Figure 5. Identification of molecular clusters related to cuproptosis in AA. (A) Cluster-consensus matrix when k = 2. (B) PCA visualized the distribution of two subtypes (C1 and C2). (C) The expression of 4 CRGs in two clusters. (D) The difference in the activity of signaling pathway between C1 and C2 clusters.
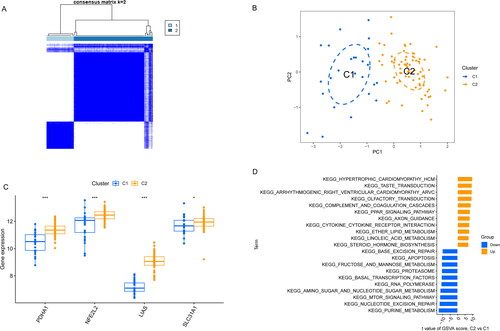
Figure 6. Co-expression network of CRGs in AA. (A) The option of soft threshold (power). (B) Clustering dendrogram of genes in co-expression modules. Different colors represented distinct co-expression modules. (C) Clustering of module eigengenes. (D) The correlations heatmap among 11 modules. (E) Correlation analysis between module eigengenes and clinical status. A row represented a module. A column indicated a clinical status. (F) Scatter plot between black module and the gene significance for AA.
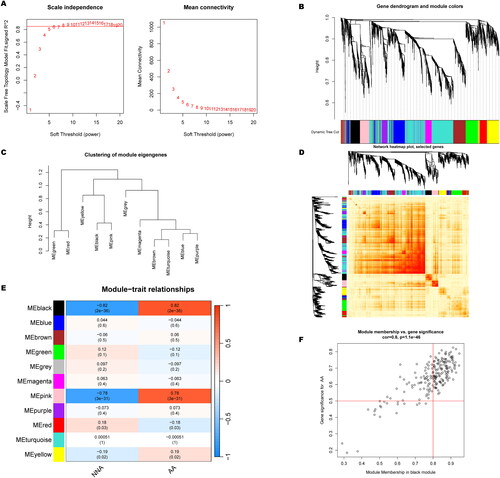
Figure 7. Co-expression network of CRGs in two cuprotosis clusters. (A) The option of soft threshold (power). (B) Clustering dendrogram of genes in co-expression modules. Different colors represented distinct co-expression modules. (C) Clustering of module eigengenes. (D) The correlations heatmap among 10 modules. (E) Correlation analysis between module eigengenes and clinical status. A row represented a module. A column indicated a clinical status. (F) Scatter plot between pink module and the gene significance for Cluster 2.
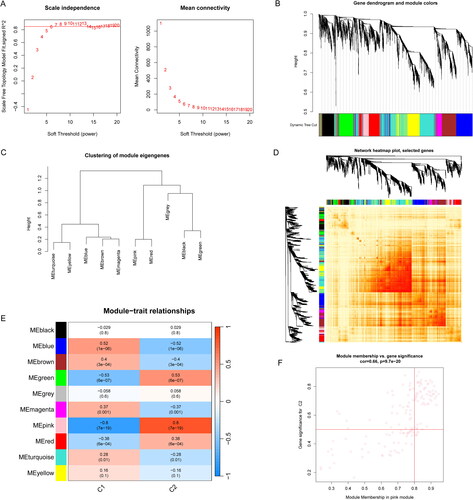
Figure 8. Construction of RF, SVM, GLM, and XGB machine learning models. (A) The overlapping gene between Disease WGCNA and Cluster WGCNA. (B) The reverse cumulative residual distribution of each machine learning model. (C) The important features in four machine models. (D) The residuals of each machine learning model were presented in boxplots. (E) ROC analysis of four machine models based on fivefold cross-validation in the testing group.
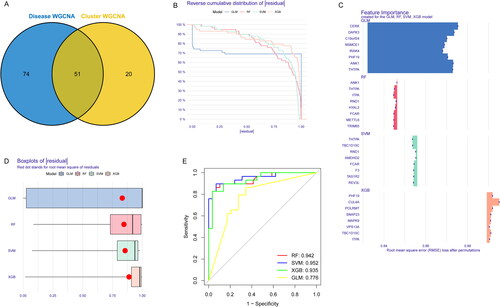
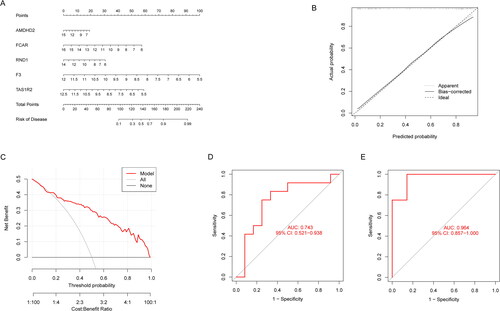
Figure 9. Verification of the 5-gene-based SVM model. (A) Construction of a nomogram for predicting the risk of AA clusters based on the 5-gene-based SVM model. (B-C) The prediction power of Nomogram was evaluated. (D) ROC analysis of the 5-gene-based SVM model between baseline and AA based on fivefold cross-validation in GSE40888 dataset. (E) ROC analysis of the 5-gene-based SVM model between AA and NNA based on fivefold cross-validation in GSE40888.
Data availability statement
The datasets analyzed in the current study is available from the GEO (https://www.ncbi.nlm.nih.gov/geo/) database. All these data are available from publicly available databases. This study complies with their data use and distribution rules.