3,071
Views
35
CrossRef citations to date
0
Altmetric
The Aerosol Science and Technology of Electronic Cigarettes

Characteristics of secondhand electronic cigarette aerosols from active human use

, , , , , , & show all
Pages 1368-1376 | Received 08 Feb 2017, Accepted 04 Jul 2017, Published online: 01 Aug 2017

Figures & data

Figure 1. The calibration curve of DustTrak for sampling PM2.5 from electronic cigarette emissions. The dashed lines stand for 95% confidence intervals.
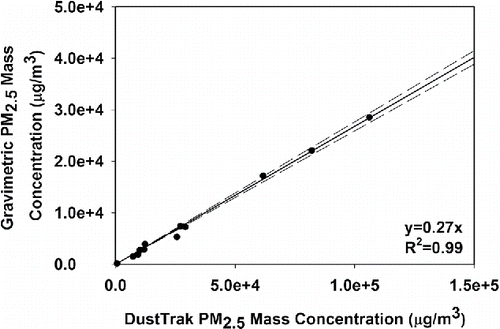
Figure 1. The calibration curve of DustTrak for sampling PM2.5 from electronic cigarette emissions. The dashed lines stand for 95% confidence intervals.

Figure 2. The time series of the mean value of (a) PNC and (b) PM2.5 mass concentration at two locations, 0.8 and 1.5 m away from EC users. The number of samples (n) is also provided.
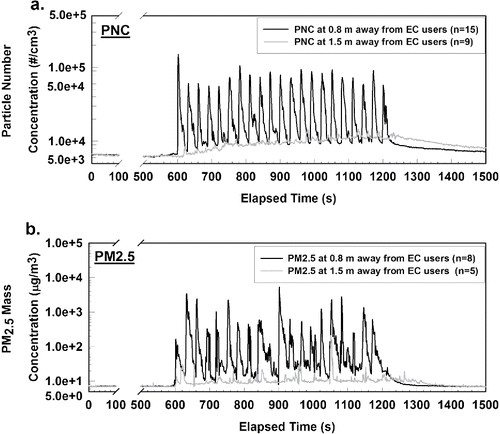
Figure 2. The time series of the mean value of (a) PNC and (b) PM2.5 mass concentration at two locations, 0.8 and 1.5 m away from EC users. The number of samples (n) is also provided.

Figure 3. The mean (a) PNC and (b) PM2.5 of SHV emissions at increasing distances from the EC users. The dots above or below the boxes represent the outliers, which are beyond 1.5 IQR (Interquartile Range). The upper line above each box represents the maximum data within 1.5 IQR, and the lower line below each box represents the minimum data within 1.5 IQR. The solid line in each box represents the median value, and the dash line in each box represents the mean value.
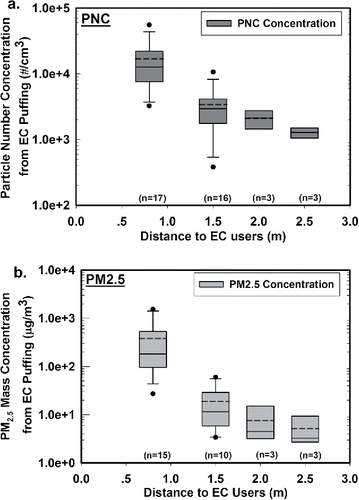
Figure 3. The mean (a) PNC and (b) PM2.5 of SHV emissions at increasing distances from the EC users. The dots above or below the boxes represent the outliers, which are beyond 1.5 IQR (Interquartile Range). The upper line above each box represents the maximum data within 1.5 IQR, and the lower line below each box represents the minimum data within 1.5 IQR. The solid line in each box represents the median value, and the dash line in each box represents the mean value.
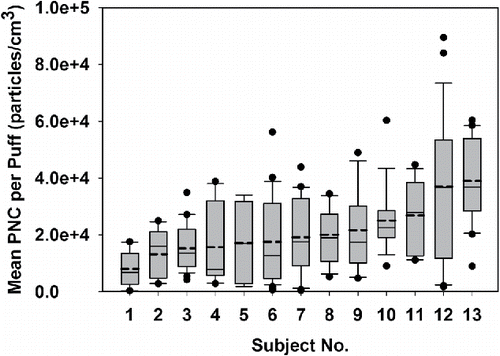
Figure 4. The mean PNC per puff (particles/cm3) for each subject. The dots above or below the boxes represent the outliers, which are beyond 1.5 IQR (Interquartile Range). The upper line above each box represents the maximum data within 1.5 IQR, and the lower line below each box represents the minimum data within 1.5 IQR. The solid line in each box represents the median value, and the dash line in each box represents the mean value.
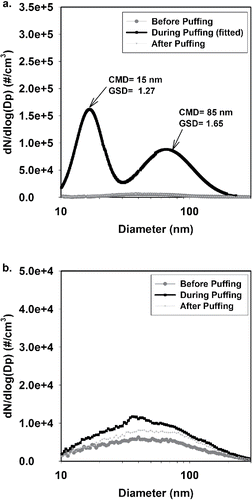
Figure 4. The mean PNC per puff (particles/cm3) for each subject. The dots above or below the boxes represent the outliers, which are beyond 1.5 IQR (Interquartile Range). The upper line above each box represents the maximum data within 1.5 IQR, and the lower line below each box represents the minimum data within 1.5 IQR. The solid line in each box represents the median value, and the dash line in each box represents the mean value.

Figure 5. The particle size distributions of SHV aerosols measured at (a) 0.8 m and (b) 1.5 m away from EC users. CMD: count median diameter; GSD: geometric standard deviation.

Figure 5. The particle size distributions of SHV aerosols measured at (a) 0.8 m and (b) 1.5 m away from EC users. CMD: count median diameter; GSD: geometric standard deviation.
Supplemental material

UAST_1355548_Supplementary_File.zip

Download Zip (355.5 KB)

Reprints and Corporate Permissions

Please note: Selecting permissions does not provide access to the full text of the article, please see our help page How do I view content?

To request a reprint or corporate permissions for this article, please click on the relevant link below:

Academic Permissions

Please note: Selecting permissions does not provide access to the full text of the article, please see our help page How do I view content?

Obtain permissions instantly via Rightslink by clicking on the button below:

If you are unable to obtain permissions via Rightslink, please complete and submit this Permissions form. For more information, please visit our Permissions help page.