Figures & data
Figure 1. A schematic diagram of the aerosol generation and sampling system.
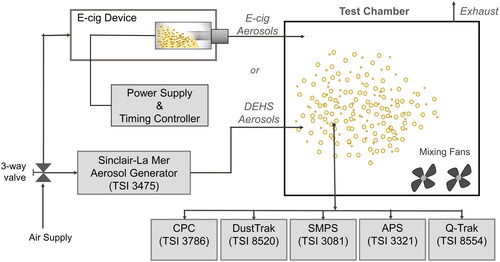
Figure 2. Decay curves for PNC and PM2.5 shown in (a) normalized concentration, Ct/Ct=0, and (b) log-normalized concentration, ln (Ct/Ct=0). The plotted data were collected with the e-liquid mixture having a PG/VG ratio of 30/70 without nicotine.
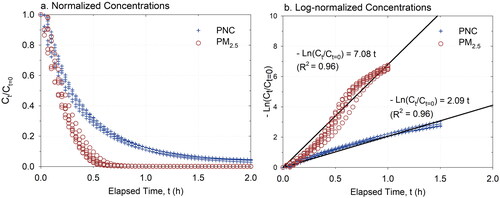
Table 1. The mean (standard deviation) of emission factor (Sp), initial concentrations (Ct=0), and the time (t50) taken to achieve 50% of Ct=0 for each e-liquid mixture and DEHS aerosols evaluated in the study.
Figure 3. Averaged normalized concentration (Ct/Ct=0) decay curves for PNC (a and b) and PM2.5 (c and d). The plotted data provide the means of six repeated measurements without nicotine (0.0%; a and c) and with nicotine (2.4%; b and d) in comparison to DEHS aerosols.
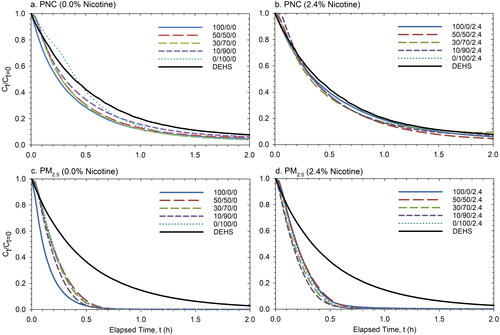
Figure 4. Particle loss rates as measured by (a) PNC and (b) PM2.5 at different PG/VG ratios with 0.0% and 2.4% nicotine compared with DEHS. Statistically significant differences are noted with *(p < 0.001, Student’s t-test).
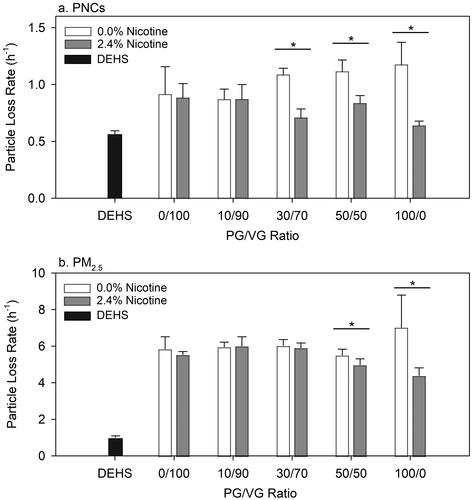
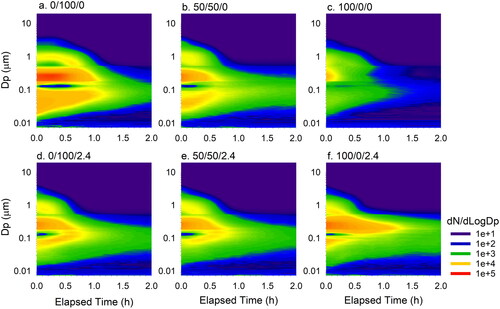
Figure 5. Averaged particle size distributions (dN/dLogDp) for e-liquid mixtures (i.e., PG/VG =0/100, 50/50, and 100/0) without nicotine (0.0%; a, b, and c) and with nicotine (2.4%; d, e, and f). The vertical axes represent particle size on a logarithmic scale, the horizontal axes represent elapsed time in hours from the start of sampling, and the color scale represents particle number concentration at a certain time and diameter. Linear interpolation is used to fill the data gap between the SMPS and APS output (289 nm–540 nm).