857
Views
20
CrossRef citations to date
0
Altmetric
ORIGINAL ARTICLE

Intensive community pharmacy intervention had little impact on triptan consumption: A randomized controlled trial

, , , , , , , , & show all
Pages 16-21 | Received 20 May 2005, Published online: 12 Jul 2009

Figures & data

Figure 1.  Flow chart.

Figure 1.  Flow chart.

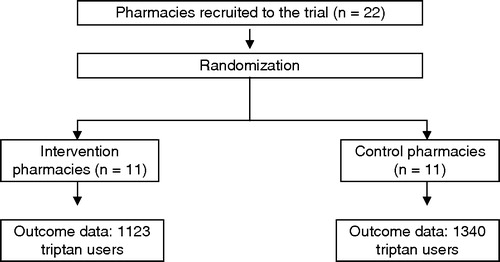
Table I.  Characteristics of triptan users in intervention and control groups: Number (percentage of total users within each group) unless otherwise stated.

Table II.  Geometric means of patients’ triptan consumption (doses per month) for 3-, 6-, and 9-month periods before and after visiting an intervention or control pharmacy: Effect of intervention expressed as an intervention/control ratio (desired effect: less consumption in intervention group, ratio < 1),1 divided by incident and prevalent users and stratified by baseline consumption (95% CI adjusted for clustering at pharmacy level).

Reprints and Corporate Permissions

Please note: Selecting permissions does not provide access to the full text of the article, please see our help page How do I view content?

To request a reprint or corporate permissions for this article, please click on the relevant link below:

Academic Permissions

Please note: Selecting permissions does not provide access to the full text of the article, please see our help page How do I view content?

Obtain permissions instantly via Rightslink by clicking on the button below:

If you are unable to obtain permissions via Rightslink, please complete and submit this Permissions form. For more information, please visit our Permissions help page.