Figures & data
Figure 1. Inclusion of GPs, participation and completion of the intervention. MCMO: Municipality Chief Medical Officer.
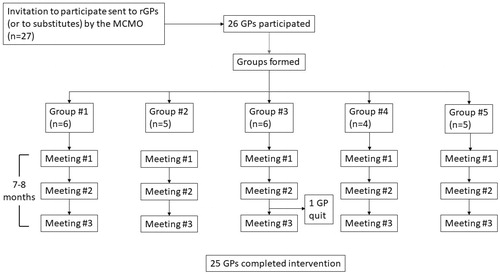
Table 1. The list of potentially inappropriate drugs (PIDs) used in the study.
Table 2. Results from selected questions in the evaluation form filled in by participants at the last (third) peer group meeting (n = 25).
Table 3. Test results comparing slopes for the regression lines of dispensed defined daily dosages for each drug class.
Figure 2. Run chart plotting the number of reported medication reviews per general practitioner per month in the intervention community and in all of Norway. The median for the intervention municipality is shown by the horizontal solid line for statistical process control analysis purposes. Period January 2018 to September 2019 (not including July and August months). MR: medication review.
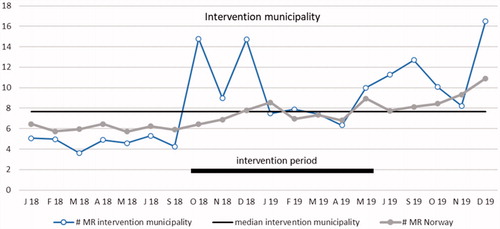
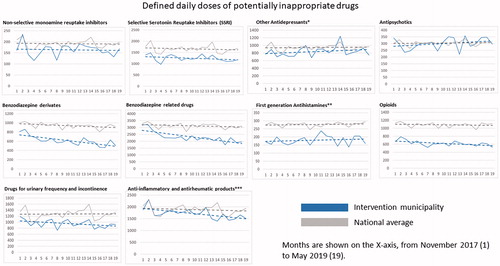
Figure 3. Regression lines for dispensed DDDs of each medication class and all medication classes combined per 1000 persons aged 65 years or older. Data are shown for each month from November 2017 (month 1) to May 2019 (month 19). *Including Selective Noradrenergic Reuptake Inhibitors (SNRI); **including diphenylmethane derivatives; ***non-steroids.