Figures & data
Table 1. Participation rate in the population study of women in Gothenburg.
Figure 1. (a) Level of Hb in different examination years, mean values and SD. (b) Mean Hb level (g/L) in 38-year-old women. (c) Mean Hb level (g/L) in 50-year-old women.
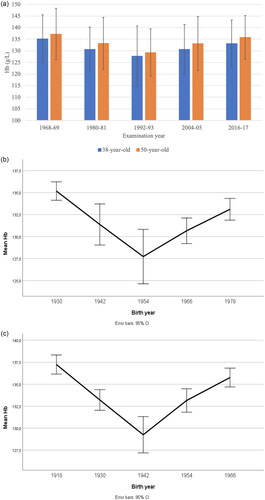
Table 2a. Differences in mean values in Hb between 38-year-olds in different examination years.
Table 2b. Differences in mean values in Hb between 50-year-olds in different examination years.
Table 3. Changes in Hb after adjustments for covariates, with examination 2016–2017 used as a reference.
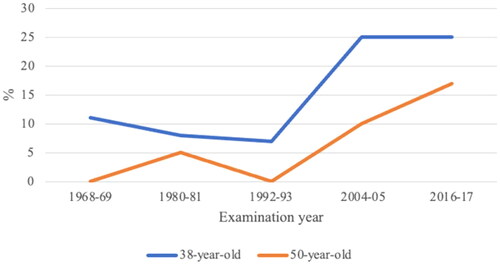
Figure 2. (a) Trends of anaemia and elevated Hb in 38-year-olds. Results from logistic regression models show significant non-linear trends in anaemia and elevated Hb, p = .004 and .0002, respectively. (b) Trends of anaemia and elevated Hb in 50-year-olds. Results from logistic regression models show significant non-linear trends in anaemia and elevated Hb, p = .0004 and .01, respectively.
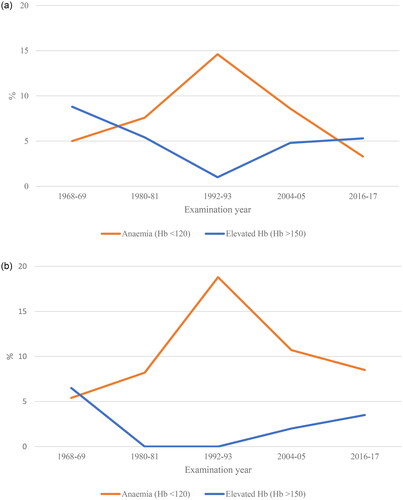
Figure 3. Use of hormonal contraceptives.