Figures & data
Table I. Abbreviations.
Table II. A summary of the methods used for calculating the absorbed dose and the median, minimum and maximum of the absorbed dose per unit of injected activity for all ad of the radiopharmaceutical (131I-LL2).
Figure 1. Whole-body images (left: anterior, right: posterior) 24 hours after administration for patient:treatment number 6:1. The total body ROI, the sacrum ROI and the ROI for background correction are shown.
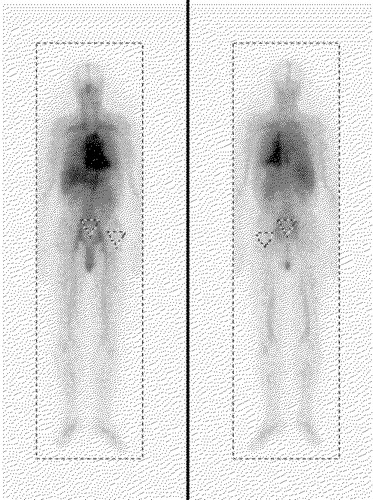
Figure 2. The CT scan of the sacral region for patient:treatment 6:1. Since the sacroiliac joint moves sagittally oblique the distance between the ventral and dorsal measurements differs. The mean of the ventral and dorsal measures was used when determining the width of the sacrum in order to correct for this difference.
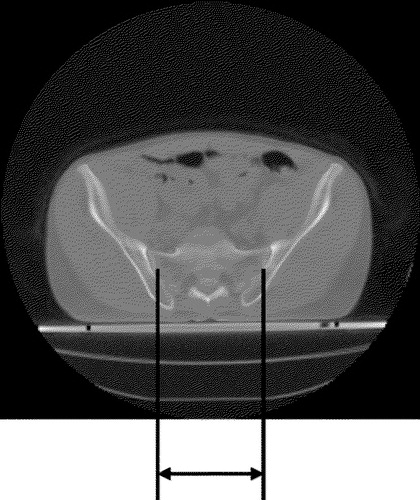
Figure 3. The percent of injected activity per millilitre of a) blood and b) plasma as a function of time for all the patients. (Please note that the x-axes are shortened to make the data in the figures clearer.)
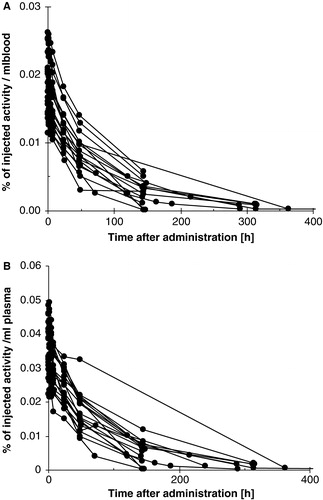
Figure 4. The percent of injected activity that is present in sacrum as a function of time for all the patients. The activity was determined from scintillation camera images by the geometric mean method.
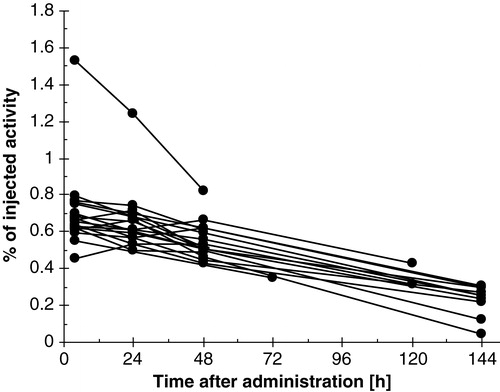
Figure 5. The percent of injected activity in whole body as a function of time after administration for all the patients. The data was determined from a) single probe measurements and b) scintillation camera whole body-scans.
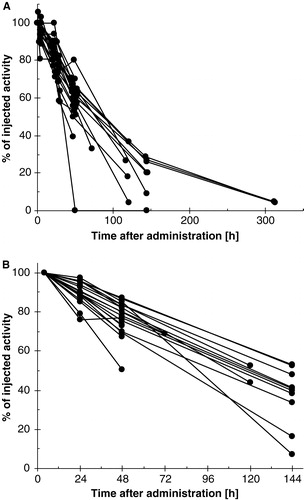
Figure 6. Interpatient variability: Absorbed dose to bone marrow per unit injected activity calculated with the four variations of the blood method (BL1–BL4) and the imaging method (IM) and absorbed dose to the total body per unit injected activity, calculated based on either external probe measurements (TB1) or the total body counts in scintillation camera images (TB2). The order of the patients is the same for all methods.
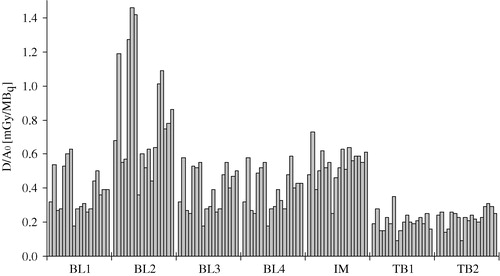
Table IIIa. Absorbed dose to red marrow per unit administered activity for all patients and RIT treatments using the blood methods and the sacrum imaging method.
Table IIIb. Absorbed dose to total body per unit administered activity for all patients and RIT treatments using the total body approximation methods.
Table IV. Fraction of self-absorbed dose to the total absorbed dose to the red marrow (DRM←RM/DRM).
Table V. Variation of HCTpat and the calculated RMBLR for all patients and RIT treatments. (RMBLR = 0.19/(1-HCTpat))
Table VI. The correlation coefficients of the absorbed dose per unit injected activity for all the methods investigated for red marrow dosimetry.
Table VII. The correlation coefficients of the absorbed dose and the maximum drop in number of platelets and the absorbed dose and the time to nadir.