Figures & data
Figure 1. Theoretical predictions of the tumour response to radiation for a tumour tissue well supplied with oxygen. a) oxygenation of the tissue as histograms (inset–full tissue oxygenation map). b) predicted response to single doses of radiation. c) response from fractionated treatments. Solid lines–predictions for a continuous distribution of oxygen tensions in tumours. Dashed lines–predictions for a ‘black-and-white’ (binary) distribution of oxygen tensions in tumours.
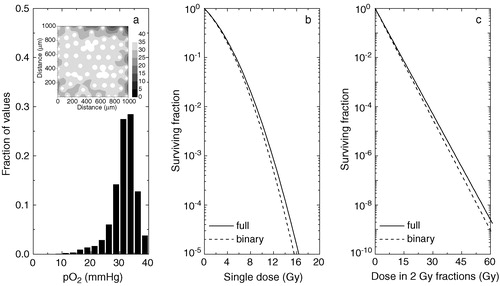
Figure 2. Theoretical predictions of the tumour response to radiation for a tumour tissue with impaired oxygen supply. a) oxygenation of the tissue as histograms (inset–full tissue oxygenation map). b) predicted response to single doses of radiation. c) response from fractionated treatments. Solid lines–predictions for a continuous distribution of oxygen tensions in tumours. Dashed lines–predictions for a ‘black-and-white’ (binary) distribution of oxygen tensions in tumours.
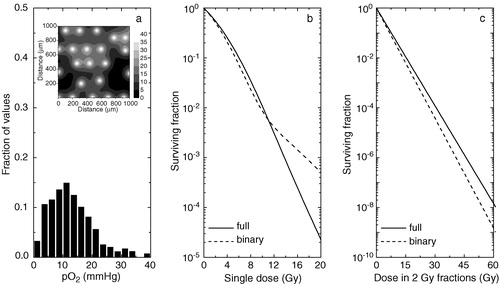
Figure 3. Theoretical predictions of the tumour response to radiation for a tumour tissue with poor oxygenation. a) oxygenation of the tissue as histograms (inset–full tissue oxygenation map). b) predicted response to single doses of radiation. c) response from fractionated treatments. Solid lines–predictions for a continuous distribution of oxygen tensions in tumours. Dashed lines–predictions for a ‘black-and-white’ (binary) distribution of oxygen tensions in tumours.
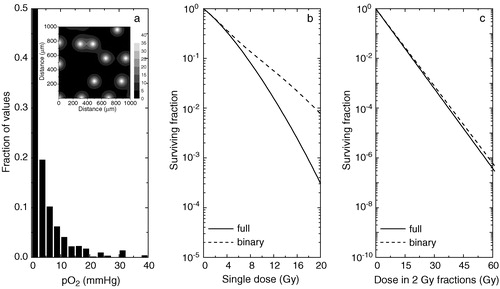
Table I. Estimated tumour control probabilities (TCP) after 30 fractions for tissues with various degrees of oxygenation
Table II. Effects of the temporal variation of the distribution of acute hypoxia in tumours