Figures & data
Figure 1. Immunohistochemical visualization of microvessels in the mesenteric window of a rat receiving a continuous infusion for seven days of paclitaxel at 16 mg/kg/w (a) and cremophore vehicle (b). Arrows indicate an intersection, while arrowheads indicate interconnecting loops (not all intersections and loops are indicated) and asterisks indicate sprouts although the field of view is not from the edge of the microvascular tree. Note the lower density of microvessels in a. The distance between two adjacent lines is 10 µm.
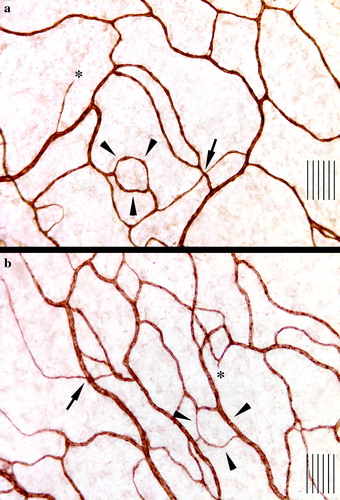
Figure 2. Effect on VEGF-A-mediated angiogenesis following metronomic chemotherapy with cyclophosphamide (two experiments), doxorubicin (four experiments) and paclitaxel (three experiments). The agents were infused continuously as monotherapy or in the case of doxorubicin in combination with continuously infused N-acetylcystein (NAC) at 192 mg/kg/day or 64 mg/kg/day for seven consecutive days before sacrifice. Mean ± SEM data for total microvascular length (TMVL) that is a composite measurement of vascularized area (a measurement of microvessel spatial extension) times the mean of microvascular length (a measurement of microvessel density). Each treatment group comprised 10–14 animals and was compared to vehicle control. Data expressed as percentage of control. P-values of statistically significant effects compared with controls are indicated. Significant dose-dependent differences in individual experiments are given as asterisks: * in the case of cyclophosphamide and ** in the case of paclitaxel.Note that the significant antiangiogenic effect of cyclophosphamide and paclitaxel was observed only when the commercially available antioxidants mannitol and cremophor EL were used as vehicle and not when saline was used as control vehicle. Doxorubicin, on the other hand, did not in any of the four experiments demonstrate a significant angiogenesis-modulating influence, not even when co-treated with NAC, a potent antioxidant, at two doses. For the effect on sprouting, see . For comparison ith bolus treatment, see Fig. 4.
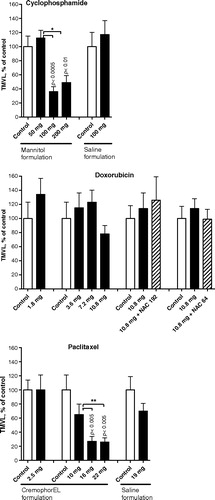
Figure 3. Proangiogenic effect on VEGF-A-mediated angiogenesis by cisplatin (four experiments) and fluorouracil (five experiments) when infused continuously as monotherapy and when co-treated with the free-radical scavenger N-acetylcystein (NAC) at 192 mg/kg/day for seven consecutive days before sacrifice. Mean ± SEM data for total microvascular length, TMVL (vascularized area times the mean of microvascular length) is shown as percentage of saline vehicle control. Each treatment group comprised 10–14 animals. Figures indicate statistically significant effects compared with controls. P-values for differences between different doses of either cytoxic or due to NAC co-treatment are also indicated.No significant antiangiogenic effect was observed following metronomic treatment with cisplatin and fluorouracil. Instead, a significant proangiogenic influence was induced by cisplatin in three of four experiments and with fluorouracil in one of five experiments. It is noteworthy that the co-treatment with NAC significantly reduced the angiogenic response of fluorouracil, while it significantly and fully normalized the proangiogenic effect of cisplatin. For the effect on capillary sprouting, see . For effect on microvessel and sprout growth and pattern formation, see .
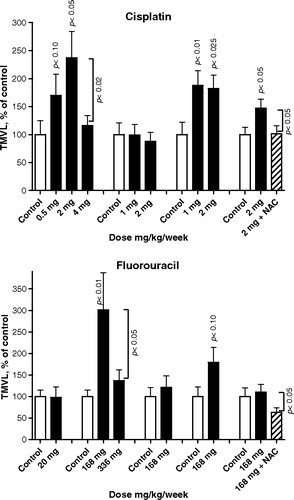
Figure 4. Data showing total microvascular length, TMVL, mean ± SEM. The chemotherapy was given either metronomically as a continuous infusion (filled squares) on Days 7 to 14 after the start of the angiogenic VEGF-A-treatment (lasting Days 0–4) or as a single bolus injection (open circles) on Day 7, i.e. 7 days before sacrifice. Each graph compares two separate dose-response experiments. On the abscissa the dose is expressed as mg/kg/week for continuous infusion or as mg/kg×1 seven days before sacrifice for i.v. bolus treatment. Detailed bolus data are published in part in (14). On the ordinate the data are expressed as percentage of the corresponding vehicle control. The vehicles were the same in the bolus and the metronomic scheduling except for the highest bolus doxorubicin dose for which 0.75 mg/ml para-hydroxibenzoate, 37.5 mg/ml lactos was used as vehicle. Each treatment group comprised 10–14 animals, apart from the doxorubicin control group which comprised 8 animals.Data points labelled with asterisks denote statistically significant differences compared to the respective control (* p < 0.05, ** p < 0.01 and *** p < 0.005). In terms of TMVL, cisplatin, cyclophosphamide and paclitaxel exerted significant or almost significant changes that were similar with either type of administration schedule. By contrast, while doxorubicin bolus treatment significantly suppressed angiogenesis no such effect was observed following the metronomic treatment. Note also the general trend to a proangiogenic effects, i.e. values above respective control experiment (100% dotted line), for cisplatin and the antiangiogenic effects for cyclophosphamide and paclitaxel (and for doxorubicin bolus treatment), i.e. values below the 100% dotted line.
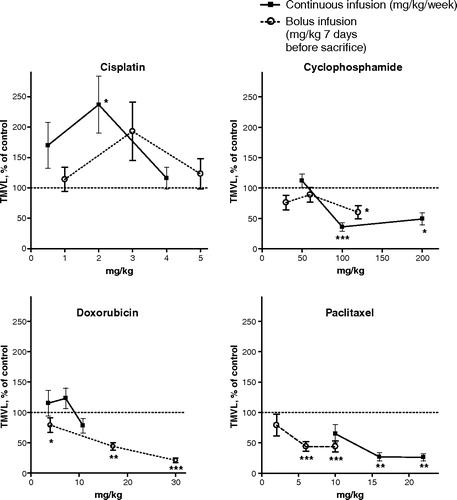
Table I. The effect of on microvessel growth and pattern formation and on capillary sprouting in VEGF-A-mediated angiogenesis following metronomic treatment with fluorouracil (168 mg/kg/w) as mono-therapy or when co-treated with N-acetylcystein, NAC (192 mg/kg/day).Number of microvessel segments per tissue unit volume, No. MS; number of microvessel branching points per tissue volume unit, No. BP; length of individual microvessel segments (i.e. the actual distance between two successive branching points), Le. MS; number of capillary sprouts per unit tissue volume, No. SP; and length of individual sprouts, Le. SP. Figures in bold and related p-values indicate significant difference compared with fluorouracil + saline vehicle. There was no significant difference in statistical terms between the fluorouracil + saline group and the saline + saline group. Each treatment group comprised 12–14 animals. Not done, N.D. Lengthening of Le. MS or Le. SP, [+]. Mean±SEM. When NAC was combined with fluorouracil, the microvessel network and capillary sprouts were altered in many ways: No. MS, No. BP and No. SP were significantly reduced, while the longest Le. MS, those of the 90–100 percentile, lengthened significantly, as did the longest Le. SP, those of the 90–100 percentile.
Table II. Effect on capillary sprouting in VEGF-A-mediated angiogenesis following metronomic treatment with the antiangiogenic cytotoxics cyclophosphamide and paclitaxel and the proangiogenic cytotoxics cisplatin and fluorouracil for seven consecutive days before sacrifice. Number of capillary sprouts per unit tissue volume, No. SP; and length of the individual capillary sprouts, Le. SP.All Le. SPs were pooled and ranked according to size in each treatment group. For statistical comparisons of the treatment groups, we focused on the shortest and the longest sprouts, i.e. those of the 0–10 and 90–100 percentiles. Lengthening of Le. SP, [+]. Shortening of Le. SP, [−]. P-values are for comparison with vehicle controls. Each treatment group comprised 10–12 animals. The number of sprouts (No. SP) varied between 768 and 1,369 per treatment group. Mean±SEM. Cyclophosphamide and paclitaxel significantly reduced the No. SP. Cisplatin, on the other hand, increased the No. SP significantly, while fluorouracil insignificantly increased the No. SP. Moreover, cisplatin, fluorouracil and paclitaxel significantly shortened the shortest Le. SP, those of the 0–10 percentile, and insignificantly reduced the median Le. SP. By contrast, cyclophosphamide insignificantly lengthened the shortest Le. SP and significantly lengthened the median Le. SP. Clearly, sprouting was affected agent-specifically.
Table III. Metronomic and bolus treatment: Effect on capillary sprouting in VEGF-A-mediated angiogenesis by paclitaxel and cyclophosphamide. The number of sprouts per unit tissue volume, No. SP; the length of individual sprouts, Le. SP, in terms of the shortest Le. SP, i.e. the 0–10 percentile, the longest Le. SP, i.e. the 90–100 percentile; and the median Le. SP.The bolus data are from [16]. The vehicles were the same in the bolus and the metronomic scheduling. Paclitaxel was given metronomically at 16 mg/kg/w for seven consecutive days and at 10 mg/kg when given as a single intravenous bolus injection seven days before sacrifice. Cyclophosphamide was given metronomically at 100 mg/kg/w for seven consecutive days and at 60 mg/kg when given as a single intravenous bolus injection seven days before sacrifice. P-values are given for differences with vehicle controls. Statistically insignificant difference compared with vehicle controls, n.s. Lengthening of Le. SP, [+]. Shortening of Le. SP, [−]. Each treatment group comprised 9 or 12 animals. The number of sprouts (No. SP) per treatment group varied between 768 and 1,088. The metronomic and bolus treatments induced approximately similar effects on the No. SP and the Le. SP with the exception of cyclophosphamide. Cyclophosphamide metronomic treatment significantly reduced the No. SP, while the cyclophosphamide bolus treatment insignificantly increased the No. SP.