Figures & data
Figure 1. DVH's of the bladder, the rectum and the GTV of 2D treated patient replanned using 3D methodology. The y-axis represents the normalised volume. The x-axis represents the dose measured in Gray (Gy).Where the thick black horizontal line (a) intersects the GTV (d), the bladder (c) and the rectum (b) curves is 100% of these volumes, so where the thick black vertical lines cut the x-axis is the dose received at 100% of the volumes of interest. Where the thick blue horizontal line (e) intersects the GTV (h), the bladder (g) and the rectum (f) curves is 90% of these volumes, so where the thick blue vertical lines cut the x-axis is the dose received at 90% of the volumes of interest. Where the thick red horizontal line (i) intersects the GTV (l), the bladder (k) and the rectum (j) curves is 50% of these volumes, so where the thick red vertical lines cut the x-axis is the dose received at 50% of the volumes of interest. Zero per cent of the volumes of interest are where the DVH curves cut the x-axis, this is circled in green. The PTV curve was very similar to the GTV curve and was removed from this illustration for the purposes of clarity.
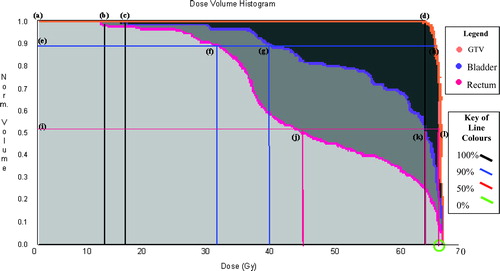
Figure 2. Area under the DVH Curves of 2D treated patient replanned using 3D methodology. The y-axis represents the absolute volume measured in cm3. The x-axis represents the dose measured in Gray (Gy). The area under the pink DVH curve (in light grey) represents the dose gained for the rectal volume. The area under the purple DVH curve (in medium and light grey) represents the dose gained for the bladder volume. The area under the orange DVH curve (in dark, medium and light grey) represents the dose gained for the GTV volume. The PTV curve was very similar to the GTV curve and was removed from this illustration for the purpose of clarity.
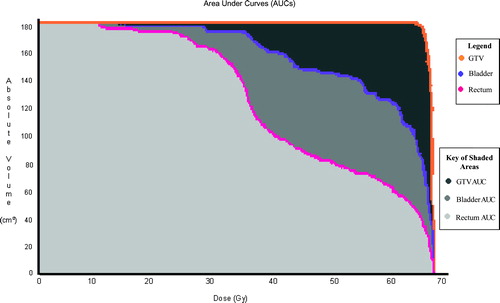
Table I. Dosages received by varying proportions of the GTV when planned using a 2D or 3D technique. No significant difference was detected for the GTV at 0% (D0). However, there were significant differences at 100% (D100), 90% (D90) and 50% (D50) of the GTV.
Table II. Dosages received by varying proportions of the PTV when planned using a 2D or 3D technique. No significant difference was detected for the PTV at 0% (D0). However, there were significant differences at 100% (D100), 90% (D90) and 50% (D50) of the PTV.
Table III. Dosages received by varying proportions of the bladder volume when planned using a 2D or 3D technique.No significant differences were detected for any of the bladder volumes, although the dose received by the100% volume (D100) approached significance (p = 0.05).
Table IV. Dosages received by varying proportions of the rectal volume when planned using a 2D or 3D technique.No significant difference was detected for the rectal volumes at 0% (D0). However, there were significant differences at 100% (D100), 90% (D90) and 50% (D50) of the rectal volumes.
Table V. Areas under curves of the various DVH's when planned using a 2D or 3D technique.No significant differences were detected for the bladder volume, the GTV and the PTV. However, there was a significant difference for the rectum volume.
Table VIa. Field areas for the radiation beam directions (AP, PA, RLat and LLat) when planned using a 2D or 3D technique.Significant differences were detected for all of the four field directions. AP (Anterior-Posterior), PA (Posterior-Anterior), RLat (Right Lateral) and LLat (Left Lateral)
Table VIb. Radiation treatment, rectal and bladder volumes when planned using a 2D or 3D technique.Significant differences were detected for all three volumes.